






Executive Overview
The release of Kroll’s Summer 2026 Global Software Sector Update offers an exhaustive, twenty-page X-ray of private mergers and acquisitions (M&A) and public market comparables through June 30, 2026. At first glance, the headline figures depict a roaring recovery. Deal volume is tracking toward the second-highest year on record, private M&A EBITDA multiples have experienced a notable 25% surge, and public valuation multiples have ticked upward for the first time in several quarters.
Yet, beneath this rosy exterior lies a fragmented and asymmetric market. A closer inspection of the underlying data reveals a stark reality: much of the apparent market recovery is heavily skewed by a handful of mega-deals, most notably SpaceX’s jaw-dropping $60 billion acquisition of Cursor.
Outside of these artificial anomalies, standard frameworks for evaluating B2B software companies—such as the classic Rule of 40—are increasingly breaking down. Valuations now diverge wildly between subsectors that boast nearly identical growth and margin profiles. This structural shift indicates that private equity buyers, strategic acquirers, and public market investors are pricing qualitative attributes that traditional valuation metrics fail to capture. For B2B software founders, executives, and investors, navigating this environment requires moving past broad macro trends to understand the specific dynamics governing asset pricing, category positioning, and the shifting calculus of corporate buyers.
Detailed Chronology & Deal Mechanics: The Anatomy of a Skewed Recovery
To understand the current state of software M&A, one must trace the trajectory of transaction volume and aggregate deal value through the first half of 2026. Annualized metrics for the sector point to roughly 2,672 transactions, placing 2026 firmly behind only 2025’s record-shattering count of 2,939 deals. On paper, total announced deal value is pacing toward an impressive $240 billion.
However, this aggregate figure is heavily distorted. A single transaction—SpaceX’s acquisition of Cursor for $60 billion during the first half of the year—accounts for fully half of the annualized headline value. Because Kroll’s methodology annualizes H1 figures, that single megadeal injects approximately $120 billion into the $240 billion total.
When Cursor is stripped from the equation, the annualized 2026 deal value plummets to roughly $120 billion, marking one of the lowest capital-flow totals on record. To put this in perspective, the peak-market year of 2021 saw an astronomical $429 billion in software M&A deal value.
The concentration of capital is unprecedented. In Q2 2026 alone, Cursor accounted for roughly 64% of all software deal value. Kroll’s historical data shows this to be the most concentrated single-deal impact observed in a decade of tracking the sector. The previous record was set in Q2 2022, when the combined weight of Broadcom’s acquisition of VMware and Intercontinental Exchange’s purchase of Black Knight represented 50% of total quarterly deal value.
This dynamic explains a widespread paradox currently plaguing the tech sector: why are companies with $10 million to $50 million in Annual Recurring Revenue (ARR) experiencing a flood of exploratory banker meetings yet receiving zero actionable term sheets? The volume of transactions is near record highs, but the aggregate capital deployed is heavily bottlenecked at the absolute apex of the market.
Supporting Context & Metrics: The Breakdown of Traditional Valuation Frameworks
The Collapse of the Rule of 40 Correlation
Perhaps the most revealing section of the Kroll report is its subsector analysis, which maps median Enterprise Value to Calendar Year 2026 (EV/CY26) revenue multiples against corresponding revenue growth and EBITDA margins. Historically, the "Rule of 40" served as the universal North Star for SaaS valuations. Today, that framework is losing its predictive power.
Consider the divergence between Engineering software and Human Capital Management (HCM). Both subsectors boast an identical Rule of 40 score of 46%. Yet, Engineering software commands a median multiple of 5.2x revenue, while HCM languishes at 3.0x—representing a massive 73% premium for the exact same combination of growth and profitability.
Similar anomalies abound:
- Collaboration & Productivity runs a 42% Rule of 40 score and commands a 3.1x multiple.
- Vertical Software achieves that same 42% Rule of 40 score but trades at 3.7x.
- Marketing software posts a 38% score (identical to Cyber Security), yet trades at a meager 2.1x compared to Cyber Security’s lofty 5.2x.
Growth and margin combined explain almost none of the valuation spread between these categories. Two primary hypotheses explain this divergence:

- Revenue Durability and Switching Costs (The Traditional View): Kroll’s Engineering bucket comprises legacy and specialized giants like Autodesk, Cadence, Synopsys, Dassault, PTC, and Trimble. These Electronic Design Automation (EDA) and Computer-Aided Design (CAD) providers boast decades-long switching costs and near-zero churn. Conversely, the HCM bucket—ADP, Paychex, Paycom, Workday—operates in a sticky but fiercely competitive market facing steady commoditization. This moat disparity easily justifies a wide multiple gap without invoking artificial intelligence.
- AI Agent Integration and Workflow Vulnerability (The Modern View): The market is aggressively pricing which software categories will be supercharged by autonomous AI agents and which will be rendered obsolete or compressed. Customer Experience (1.8x) and Marketing (2.1x) represent workflows where human seat counts are most directly automatable by emerging agentic systems. Conversely, ERP and Supply Chain software (6.5x) form the indispensable systems of record that AI agents must draw data from to function.
Regardless of which thesis one subscribes to, the practical takeaway for tech founders is stark: the comp set or subsector into which your business is categorized matters more to your valuation than several percentage points of growth or margin.
The Growth Cliff and the Commoditization of Margins
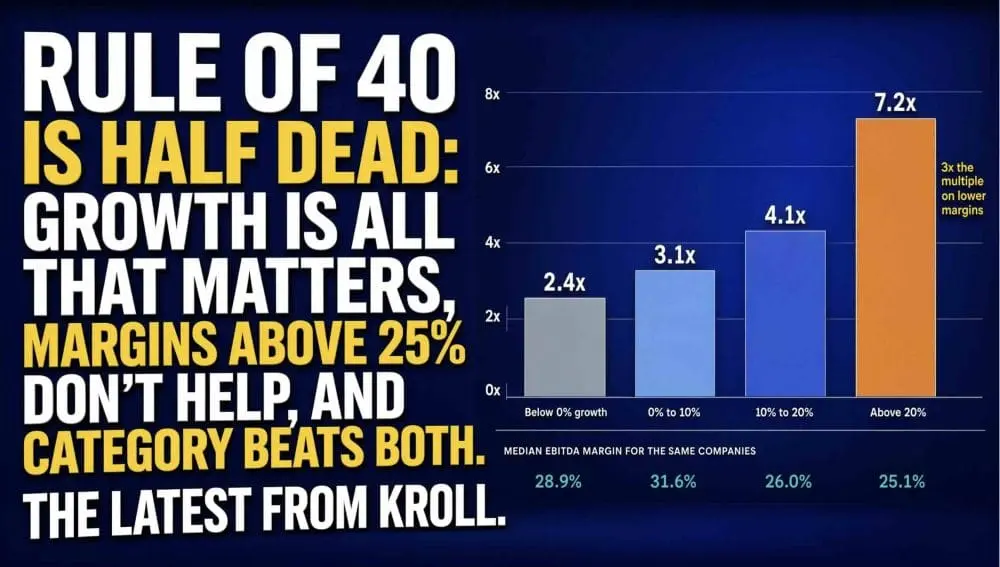
Public market valuations further underscore how drastically investor priorities have shifted. Public EV/CY26 revenue multiples broken down by growth brackets illustrate a punishing steepness:
- Negative growth: 2.4x median revenue multiple.
- 0% to 10% growth: 3.4x median revenue multiple.
- 10% to 20% growth: 5.0x median revenue multiple.
- 20%+ growth: 7.2x median revenue multiple.
The third-quartile spread widens even further, stretching from 3.4x for shrinking companies to a commanding 11.6x for companies expanding at over 20%.
Crucially, median EBITDA margins across these exact same four growth buckets remain largely flat: 28.9%, 31.6%, 26.0%, and 25.1%, respectively. High-multiple companies commanding 7.2x are no more profitable than lower-tier peers earning 2.4x. The valuation premium stems entirely from growth. Profitability has devolved from a differentiator into table stakes; a 25% to 30% EBITDA margin is simply the baseline expectation for any mature public B2B software enterprise. Squeezing margins further yields diminishing returns, making the delta between 19% and 21% growth infinitely more valuable than additional cost-cutting measures.
Official Statements & Industry Insights: Strategic M&A vs. Public Markets
A fascinating dichotomy defines the current financing ecosystem: getting acquired currently pays vastly superior dividends compared to remaining an independent public entity.
In the first half of 2026, the median Enterprise Value to Last Twelve Months (EV/LTM) revenue multiple for strategic acquisitions hit 6.0x, matching the historic 2021 peak of 6.2x and sitting well above the ten-year historical average of 4.7x. By contrast, the median EV to Next Twelve Months (NTM) revenue for public B2B software companies rests at a modest 3.3x—representing a minor 6% tick-up in Q2 but remaining depressed relative to the fifteen-year median of 5.4x.
Private EBITDA multiples mirrored this aggression, climbing 25% to 20.2x, closing in on the 2021 record of 21.4x. This valuation strength contrasts sharply with the public equity punishment dealt out over the preceding twelve months. Between June 2025 and June 2026, median stock performances across sectors suffered significant corrections:
- Financial & Accounting: Down 50.4%
- HCM: Down 42.3%
- Marketing: Down 40.8%
- Vertical Software: Down 38.4%
- Engineering: Down 35.6%
- Infrastructure: Up 26.8% (the sole positive outlier)
The aggressive bidding for private assets is driven almost entirely by corporate strategics hunting for proprietary AI capabilities, unique proprietary datasets, and entrenched workflow positions. These corporate acquirers are paying nearly double the valuations assigned by public markets and offering 1.6 turns higher than traditional financial private equity buyers. Strategics have concluded they cannot build advanced AI architectures organically fast enough, leading them to acquire talent and technology at prices that defy traditional LBO models and public investor tolerances.
Future Outlook: Strategic Imperatives for Software Leaders
Kroll’s data yields critical insights regarding corporate scale versus market positioning. When analyzing precedent EBITDA multiples by revenue size, companies with under $100 million in revenue command a first-quartile multiple of 11.5x, a median of 16.1x, and a third-quartile mark of 22.9x. For enterprises generating above $100 million in revenue, these figures shift to 12.4x, 17.3x, and 23.9x, respectively.
The scale premium is statistically real but surprisingly modest. Crossing the $100 million revenue threshold shifts the median multiple by a mere 7% (from 16.1x to 17.3x). Conversely, internal dispersion within size classes is profound: moving from the first quartile to the third quartile within the sub-$100M cohort yields a 100% valuation uplift.
In short, who you are and how defensible your workflow is matters vastly more than how big you are. Scale on its own is experiencing a deflationary trend, while defensible market positioning is commanding historic premiums.
Strategic Takeaways for B2B Leadership
- Category Framing is Paramount: Spend as much intellectual capital on positioning and narrative framing as you do on operational budgeting. Securing the right industry comp set can double your valuation independent of operational performance.
- Growth Remains King: Do not sacrifice growth in pursuit of excessive margin expansion. Once a 25% to 30% EBITDA margin is achieved, further cost discipline fails to move valuation multiples; only revenue acceleration breaks you out of the median band.
- Targeted Defensibility Beats Broad Scale: Reaching $100 million in revenue offers minimal valuation insulation if your underlying product is vulnerable to AI disintermediation. Focus on embedding your software deep into essential customer data loops.
- Leverage Strategic M&A Appetite: With corporate strategics paying significant premiums for proprietary AI and workflow control, founders should actively evaluate strategic partnership and acquisition opportunities rather than pinning their hopes on an uncooperative public market.
Source: Kroll, Global Software Sector Update, Industry Insights, Summer 2026, featuring underlying transactional and market data compiled from 451 Research, Mergermarket, Capital IQ, Pitchbook, and Gartner as of June 30, 2026.