





Executive Overview
For decades, the Initial Public Offering (IPO) has been heralded as the holy grail of startup growth—the ultimate Plan A for founders, early employees, and venture capitalists alike. Conventional wisdom holds that ringing the bell on Wall Street transforms paper wealth into liquid capital, validating years of late-night coding, strategic pivots, and dilution.
However, a cold look at market mechanics reveals a starkly different reality. For most venture capitalists (VCs) and cap table participants, the IPO date is not a liquidity date; it is merely the starting line for a grueling, multi-year distribution marathon.
While public narratives focus on high-profile public debuts, the structural reality is that the median tech company now takes 11.5 years to IPO—comfortably outliving the traditional 10-year lifespan of a standard venture capital fund. Furthermore, post-IPO lock-up agreements, staggered release schedules, and regulatory constraints like Rule 144 ensure that turning public stock into spendable cash can take nearly half a decade.
When evaluating whether to pursue a public listing or accept a multi-billion-dollar acquisition offer, founders and investors must run a sophisticated mathematical gauntlet. Accounting for compounding opportunity costs, single-stock volatility, ongoing dilution, and the time-value of money, an IPO path must generally be worth 2x to 3.2x an immediate cash M&A offer just to break even. This deep dive investigates the structural timelines of modern tech exits, examines real-world case studies from Snowflake to SpaceX, and recalculates the true cost of waiting for the public markets.
Detailed Chronology: From the First Check to the Last Share
To understand the friction of venture liquidity, one must trace the timeline from the moment an angel or seed fund writes its initial check to the day the final share is liquidated. Far from being an instantaneous event, the journey spans over a decade, crossing multiple distinct operational and regulatory phases.
The 11.5-Year Tech Timeline vs. The 10-Year Fund
According to PitchBook data, the median time to IPO for a technology company sits at 11.5 years. Simultaneously, 45% of current unicorns have spent nine years or more languishing inside private portfolios. This temporal mismatch creates immense structural pressure: standard venture capital funds operate on a strict 10-year clock (with permissible two-year extensions), meaning GPs are frequently forced to navigate public listings, secondary distributions, and protracted lock-up periods long after their fund’s formal expiration date.
The scarcity of public listings compounds this issue. Out of 649 US VC-backed exits recorded in the first half of 2025, the breakdown was heavily skewed toward private transactions:
- Acquisitions: 472 (72.7%)
- Buyouts: 150 (23.1%)
- Public Listings: 27 (4.2%)
With fewer than 5% of venture-backed companies successfully making it to the public markets, the stakes for those that do IPO are exceptionally high. Yet, even among the elite minority that cross the finish line, liquidity does not arrive overnight.
Case Studies in Post-IPO Liquidation Timelines
An examination of recent tech IPOs illustrates just how slowly cap tables unwind after the closing bell:
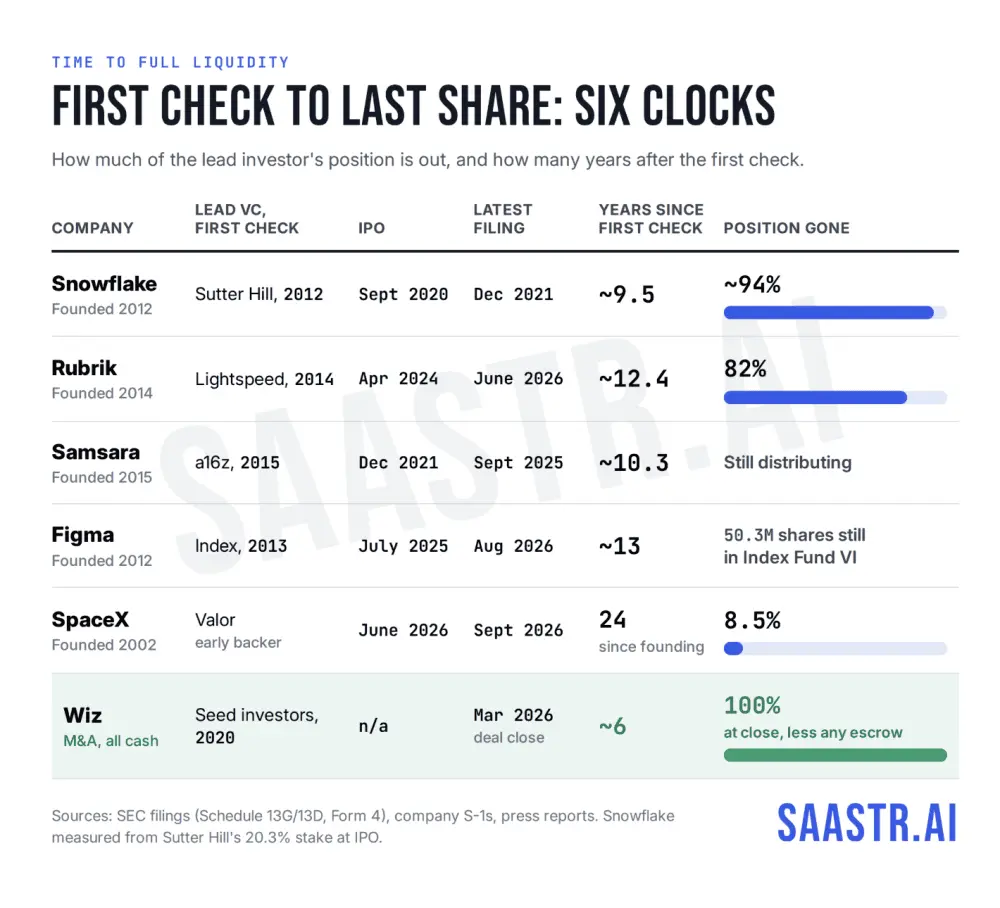
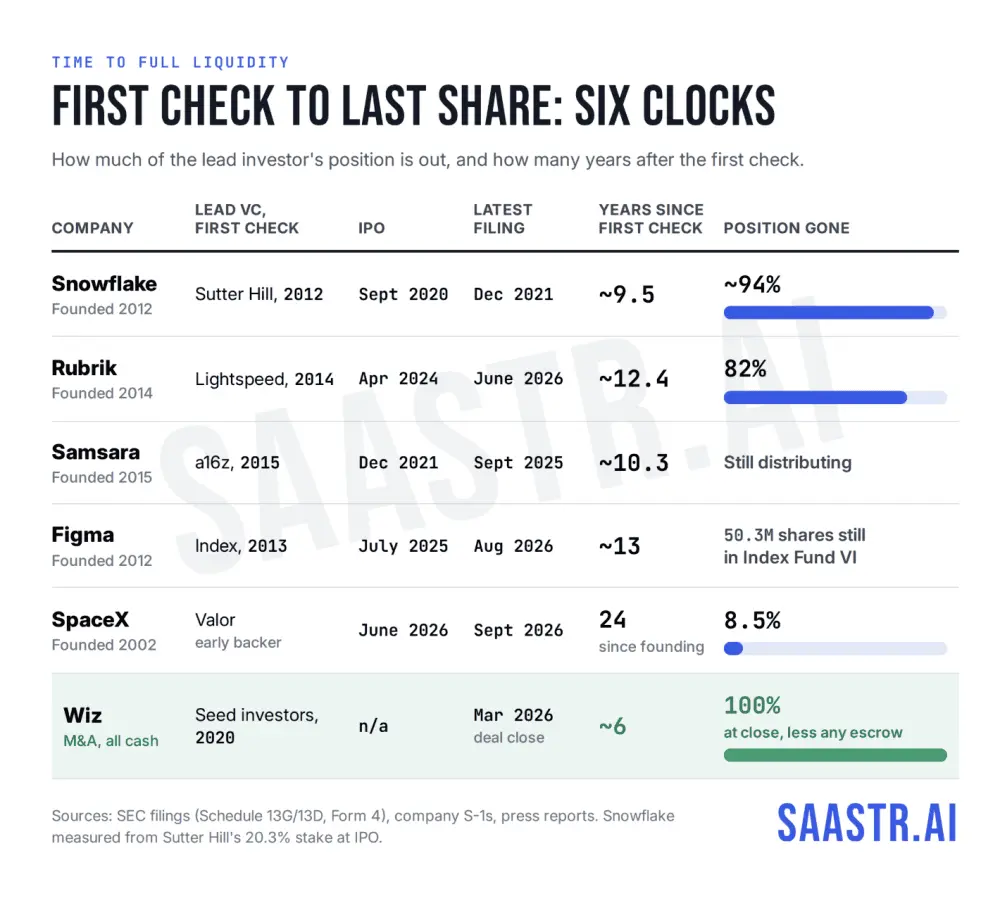
- Snowflake (The Best-Case Scenario): Snowflake achieved one of the fastest rates of comprehensive VC liquidity in the modern tech era. It took 8 years to reach an IPO, followed by an additional 15 months to whinnow holdings down to a nominal 1.3%. Fortunately, Snowflake’s stock held up robustly through the distribution window, serving as the gold standard for public exits.
- Rubrik: Twelve point four (12.4) years after its first check—and 26 months post-IPO—early backer Lightspeed was roughly 82% divested. Maintaining a steady clip of 2.4 million shares sold every six months, liquidating the final 18% requires an additional 1.5 years. Meanwhile, co-founder Bipul Sinha retained approximately 87% of his pre-IPO Class B shares long after debut, eventually utilizing a structured prepaid variable forward 12.7 years after founding just to unlock localized liquidity.
- Samsara: Founded in 2015 and public by December 2021 (a swift 6.5-year run), Samsara’s distribution saga has nonetheless dragged on. Entities tied to Andreessen Horowitz (a16z) were actively executing in-kind distributions and open-market sales nearly a decade after writing their first checks. Co-founder John Bicket, eleven years into the journey, has been methodically selling off his stake at a conservative rate of roughly 4% per year.
- Figma: Thirteen years post-founding, Figma’s cap table remains heavily weighted with legacy fund holdings. CEO Dylan Field strategically divested modest portions during the IPO and pre-unlock windows, yet a full year after going public, he retained roughly 90% (~53 million shares) of his original stake.
- SpaceX: A monumental outlier founded in 2002, SpaceX did not price its shares at $135 until mid-2026—a staggering 24-year incubation period. Rather than adhering to a traditional 180-day cliff, SpaceX implemented a staggered release schedule spanning 15 distinct distribution dates. Early backer Valor Equity Partners, having distributed a mere 8.5% of its holdings by late 2026, illustrates that even the world’s most valuable private enterprises require decades to return capital fully to Limited Partners (LPs).
Supporting Context & Metrics: M&A as the Accelerated Alternative
While IPOs represent the pinnacle of corporate achievement, mergers and acquisitions (M&A) offer a vastly compressed timeline to liquidity.
The Wiz Case Study: Speed vs. Scale
Consider the trajectory of cybersecurity titan Wiz. Founded in 2020, the company agreed to an all-cash $32 billion acquisition by Google, which officially closed in March 2026. Despite facing a grueling 12-month regulatory antitrust review spanning the United States, the European Union, Australia, and Israel, the entire lifecycle from inception to total liquidity took just six years. Founders, seed investors, and employees were made whole on the exact same day.
While M&A transactions are not entirely friction-free—data from SRS Acquiom indicates that median M&A deals involve a 10% escrow holdback (dropping to 2.8% when Representation and Warranty Insurance is utilized)—the capital is realized exponentially faster than the multi-year public market drip-feed. Furthermore, deals can occasionally collapse; the scrapped 15-month limbo between Adobe and Figma over a $1 billion breakup fee serves as a stark reminder of regulatory execution risk.
Founder Selling Patterns: Slow and Steady
Popular culture often points to Rule 144 as the primary bottleneck for insider stock sales, but the regulatory caps are actually quite generous. Rule 144 limits affiliate open-market sales to the greater of 1% of the outstanding class or the average weekly trading volume over the preceding four weeks every three months.
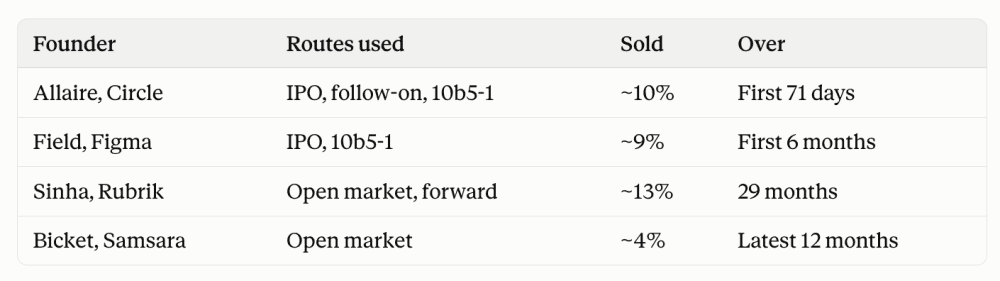
For a company like Figma, this permits an insider to dump roughly 4.5 million shares per quarter. Yet, executives rarely approach this limit. Instead, founders sell slowly—typically offloading 4% to 8% during the IPO itself, followed by a few percentage points annually. This conservative pace is driven by three primary factors:
- Signaling Risk: Large insider sales can trigger panic among retail and institutional shareholders, inadvertently depressing the stock price.
- Tax Optimization: Spreading sales across tax years helps manage capital gains liabilities.
- Long-Term Conviction: Founders often genuinely believe in the future upside of their enterprise, preferring to maintain meaningful skin in the game.
Official Statements and Quantitative Analysis: The 3x Rule
To rationally compare an uncertain, multi-year IPO path against an immediate, guaranteed M&A cash offer, financial analysts must adjust for three core variables: compounding opportunity costs, single-stock risk, and structural dilution.
[M&A Cash Offer: 6-12 Months]
        vs.
[IPO Path: 4+ Years of Dilution, Volatility, & Staggered Unlocks]
        =
IPO Must Outperform by 2.7x to 3.2x to Justify Risk
1. Compounding Opportunity Costs
Cash in hand can be immediately reinvested. Assuming a conservative index-like 10% compounding annual return, capital held in cash grows by approximately 1.46x over a four-year horizon. An IPO path must inherently surpass this baseline simply to match the time-value of money.
2. Single-Stock Risk & Hurdle Rates
Holding a single, locked-up stock exposed to a thin public float introduces severe idiosyncratic risk. Institutional investors demand a significant risk premium for bearing such volatility. At a 20% hurdle rate, the required multiple climbs to 2.07x; at a 25% hurdle rate, it hits 2.44x.
3. Ongoing Structural Dilution
Insider ownership rarely stays static post-IPO. Between follow-on offerings, equity incentive grants, and market adjustments, insider stakes continuously shrink. Factoring in a baseline 13% dilution hit at the IPO and subsequent 3% annual dilution over four years, a holder retains roughly 77% of their initial baseline stake. Consequently, the enterprise value must appreciate by 1.30x just to keep the absolute dollar value constant.
Multiplying compounding, risk hurdles, and dilution together yields a definitive mathematical reality: An IPO path must outperform an immediate M&A cash offer by 2x to tie a diversified index fund, and by 2.7x to 3.2x to adequately compensate stakeholders for the underlying risk profile.
Future Outlook: Are Secondaries Changing the Game?
As private markets mature, the rise of structured secondaries, tender offers, and direct listings is beginning to alter traditional liquidity equations. Companies like Stripe have pioneered continuous secondary liquidity, providing employees and early investors with liquidity windows roughly every six months without requiring a traditional public debut or public regulatory filings.
Similarly, modern IPOs are incorporating higher volumes of secondary shares. In recent vintage IPOs, company-issued primary shares accounted for only 86.2% of total float—down significantly from the long-run historical average of 91.5%—with existing cap table participants selling off the balance to satisfy pent-up liquidity demand.
How Secondaries Adjust the Math
Engaging in secondary tender offers changes the required risk hurdle. A founder or fund with 100% of their net worth locked up inside an illiquid asset requires a steep 20% to 25% annual return to justify the exposure. However, once an insider has successfully de-risked by pulling meaningful capital off the table via a secondary tender, the required hurdle rate drops to a more modest 10% to 15%.
Ultimately, secondaries lower the required public market multiple from roughly 3x down to 2x. They buy time for venture funds facing expiration deadlines and allow institutional backers to weather the multi-year lock-up distribution storms.
Conclusion
An Initial Public Offering remains the ultimate aspirational goal for high-growth technology companies, and exceptional outliers like Snowflake demonstrate the immense wealth-generation potential of the public markets.
However, founders and investors must discard the illusion that an IPO equals immediate liquidity. When evaluating an acquisition offer against the protracted reality of a public listing—accounting for 11.5-year medians, multi-year lock-up schedules, compounding opportunity costs, and persistent dilution—the numbers are unforgiving.
Unless an anticipated public listing is projected to outpace an acquisition offer by at least 2.7x to 3.2x, stakeholders would do well to evaluate immediate M&A liquidity offers with rigorous, unvarnished mathematical realism.