







Executive Overview
For decades, the Initial Public Offering (IPO) has been heralded as the holy grail of startup growth—the ultimate Plan A for founders, early investors, and employees whose equity has long been locked away in illiquid cap tables. Conventional wisdom dictates that once a company rings the opening bell on a major exchange, the long marathon of venture building is over, and the financial harvest begins.
However, a rigorous examination of modern tech market data reveals a striking disconnect between the IPO date and the liquidity date. While public debuts create the illusion of immediate wealth, the reality is a prolonged, tightly restricted trickle of equity distribution that often spans years. With the median tech company now taking 11.5 years to reach an IPO—while a standard venture capital fund operates on a 10-year lifecycle—the traditional timeline is fundamentally broken.
When factoring in compounding opportunity costs, inevitable public market dilution, and cascading lock-up schedules, the math yields a stark conclusion: An IPO path must realistically target a valuation 2 to 3 times higher than an all-cash M&A acquisition offer just to break even on risk-adjusted terms.
This investigative report examines the structural realities of modern tech exits, analyzing recent milestones from household names like Snowflake, Rubrik, Samsara, Figma, and SpaceX, while contrasting them with the rapid velocity of multi-billion-dollar cash acquisitions like Google’s buyout of Wiz.
Detailed Chronology: From First Check to Final Share
To understand the friction of public market exits, one must track the timeline from the moment a venture fund writes its first check to the day the last remaining share is successfully liquidated. Far from being a single catastrophic event, liquidity is an excruciatingly slow process governed by regulatory caps, phased lock-ups, and risk management.
Snowflake: The Best-Case Modern Scenario
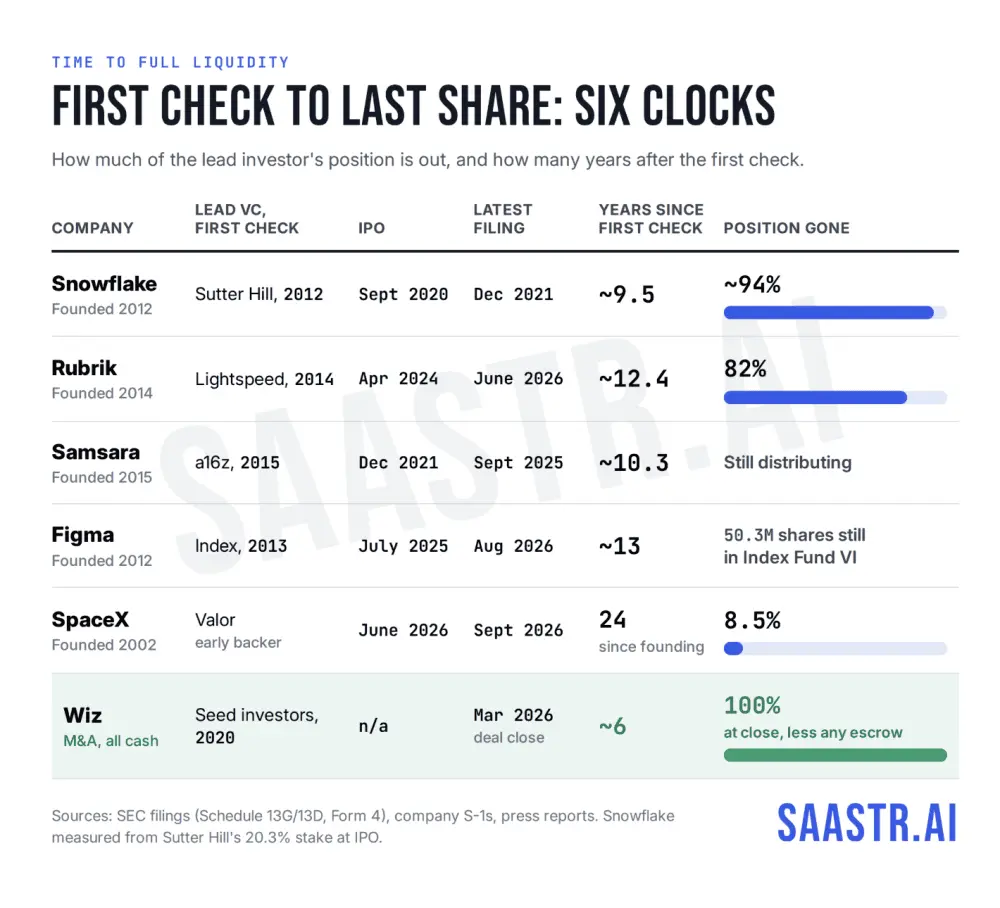
Snowflake represents one of the fastest and cleanest paths to near-complete venture capital liquidity in recent tech history. Founded and scaled aggressively, the company went public roughly 8 years after its inception. Yet, even in this best-case scenario, it took an additional 15 months post-IPO for lead investors to work their holdings down to a marginal 1.3%. While Snowflake’s stock held up remarkably well throughout the distribution window, the total clock from initial investment to comprehensive exit spanned nearly a decade.
Rubrik: 12.4 Years In and Counting
Rubrik paints a more representative picture of the modern enterprise software lifecycle. Clocking in at 12.4 years since the first check was written, early-backer Lightspeed is roughly 82% out of its position, a milestone reached 26 months post-IPO. At a steady pace of roughly 2.4 million shares sold every six months, liquidating the final 18% of its holdings will require another year and a half.
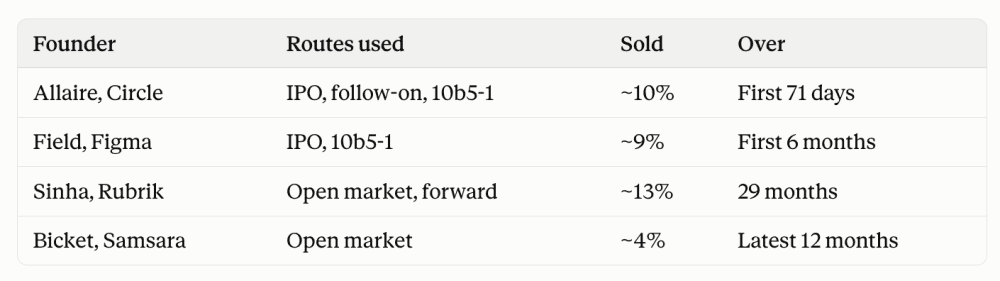
Founder Bipul Sinha has navigated this terrain with a more conservative approach. Entering the public markets with more than 12.3 million shares, Sinha retained roughly 87% of his Class B stock directly. To secure liquidity without flooding the market, he entered a prepaid variable forward—a structured financial product designed to monetize a small slice of his holdings 12.7 years after founding the company.
Samsara: Persistent Distributions Four Years Out
Founded in 2015 and executing a fast public debut in December 2021, Samsara completed its path to the public market in just six and a half years. Despite the swift IPO, share distributions have stretched deep into the decade. Entities affiliated with Andreessen Horowitz (a16z) were actively executing in-kind distributions and open-market sales nearly four years later. Filings revealed millions of remaining shares lingering long after the 10-year anniversary of the fund’s initial check. Meanwhile, co-founder John Bicket has steadily unwound his position at a measured pace, selling roughly 4% of his massive stake annually.
Figma: The 13-Year Holding Pattern
Figma’s journey underscores the sheer volume of equity that remains locked up long after a company lists. CEO and co-founder Dylan Field executed limited sales during the IPO and the pre-unlock window, offloading roughly 9% of his total stake for an estimated $190 million. Yet, a full year after hitting public markets, Field still retained nearly 50 million shares—roughly 90% of his original holdings. Concurrently, early venture funds continue to sit on massive blocks of tens of millions of undistributed shares.
SpaceX: A 24-Year Odyssey
Operating on a timeline entirely its own, SpaceX was founded in 2002 and finally priced its shares at $135 in mid-2026. Eschewing the traditional 180-day cliff, SpaceX implemented a complex, staggered release schedule spanning 15 distinct distribution dates. Early backer Valor Equity Partners reported distributing just 8.5% of its massive holdings via in-kind transfers months after trading commenced, leaving the vast majority of its investment locked behind rolling timetables extending deep into future years.
Supporting Context & Metrics: M&A Speed vs. IPO Friction
The structural friction of an IPO stands in stark contrast to the velocity of strategic mergers and acquisitions.
Consider Wiz. Founded in 2020, the cloud security powerhouse agreed to an all-cash $32 billion acquisition by Google in March 2025. Despite extensive regulatory crosswinds—triggering a grueling 12-month review process across the United States, the European Union, Australia, and Israel—the deal successfully closed in March 2026. On a single day, six years after inception, founders, seed investors, and employees were completely cashed out.
While M&A transactions are not entirely friction-free—relying on median escrows of around 10% (or roughly 2.8% when utilizing Representation and Warranty Insurance)—they bypass the multi-year volatility, thin floats, and strict regulatory drip-feeding inherent to public markets.
Furthermore, historical data highlights the rarity of the IPO path itself. During the first half of 2025, US VC-backed exits totaled 649 transactions:
- 472 acquisitions (M&A)
- 150 private buyouts
- 27 public listings
In short, only 4% of exiting companies successfully made it to a public listing, reinforcing that the IPO is an elite, statistically improbable outcome rather than a standard corporate milestone.
The Founder’s Dilemma: How Insiders Actually Sell
A common misconception among startup employees and observers is that once a lock-up period expires, founders and insiders can immediately liquidate their holdings at will. In reality, regulatory frameworks and market dynamics enforce a remarkably slow unwinding process.
While Rule 144 of the Securities Act permits affiliate insiders to sell shares, it caps open-market volume at the greater of 1% of the class outstanding or the average weekly trading volume over the preceding four weeks. For a company like Figma, this permits substantial quarterly sales, yet founders consistently choose restraint.
Three primary psychological and strategic factors slow founders down:
- Signaling Risk: Large-scale insider sales are frequently misinterpreted by public market analysts as a lack of confidence in the company’s long-term trajectory, risking downward pressure on the stock price.
- Tax Optimization: Liquidating massive blocks of equity triggers immense capital gains liabilities, prompting executives to spread sales across multiple tax years.
- Long-Term Alignment: Retaining skin in the game reassures institutional shareholders, board members, and customers that executive leadership remains fundamentally committed to enterprise value creation.
Data tracking prominent tech leaders shows that even with active secondary strategies, a founder who successfully navigates an IPO typically liquidates no more than 8% to 10% of their holdings in the opening year. Thereafter, sales slow to a conservative trickle of 2% to 4% annually.
Financial Modeling: Why an IPO Must Be Worth 3x an M&A Offer
When financial planners evaluate whether a startup should pursue an IPO or accept a lucrative M&A cash buyout, they must adjust for three foundational economic variables: Compounding, Risk, and Dilution.
[M&A Cash Offer: Paid in 6-12 Months] vs. [IPO Path: Paid over 4+ Years in Tranches]1. Compounding Opportunity Cost
Cash delivered via an acquisition can be immediately reinvested into diversified, compounding assets. Over a typical four-year post-IPO distribution window, conservative market indexes return roughly 1.46x. To match this baseline, the IPO path must inherently outperform passive investing simply to stand still.
2. Single-Stock Concentration Risk
Holding locked-up stock in a single newly public company exposes insiders to extreme volatility, particularly when navigating thin public floats. Financial planners apply a risk hurdle rate of 20% to 25% for such concentrated equity, elevating the required performance multiple to 2.07x – 2.44x.
3. Ongoing Dilution
Throughout the multi-year wait for total liquidity, a holder’s percentage ownership continuously shrinks due to post-IPO equity grants, secondary offerings, and market adjustments. Factoring in a standard 13% reduction at the IPO and subsequent 3% annual dilution, a holder retains roughly 77% of their initial stake, requiring the company’s market cap to expand by at least 1.30x merely to maintain value parity.
The Final Multiplier
Multiplying these factors together reveals that an IPO valuation must be roughly 2.7x to 3.2x higher than an immediate M&A cash offer to adequately compensate stakeholders for the time delay, structural risk, and dilution incurred over the lifecycle of a public rollout.
Future Outlook: Are Secondary Markets Changing the Equation?
As venture ecosystems mature, the rise of structured secondary transactions—exemplified by massive employee tender offers at giants like Stripe and equity distributions by Anthropic—is beginning to rewrite the traditional liquidity playbook.
Secondary markets allow founders, early investors, and long-tenured employees to de-risk their portfolios before an IPO or acquisition occurs. For venture funds sitting at year 12 of their lifecycle, securing DPI (Distributed to Paid-In capital) via secondary liquidity provides the breathing room necessary to patiently wait for an optimal IPO window.
However, secondary liquidity does not completely eliminate public market friction. The remaining 80% of an insider’s stock must still clear the traditional 3x hurdle rate, and rolling tender structures—such as SpaceX’s staggered release schedule—demonstrate that institutional underwriters are increasingly pushing back against sudden, market-flooding liquidity events.
Ultimately, market participants must approach exit strategies with analytical rigor. While an IPO remains the ultimate Plan A for generational enterprise value creation, founders and boards must weigh the illusion of public market wealth against the tangible, guaranteed security of strategic M&A. Unless an upcoming public debut is projected to outpace a strong acquisition offer by a factor of three, the wisest financial choice may well be taking the cash on the table.