







Executive Overview
For decades, the standard operating procedure for software engineering teams relied on a reactive monitoring paradigm. Dashboards filled with glowing green gauges and ominous red flashes dictated the health of an enterprise application. If CPU utilization spiked, memory leaked, or error rates crept past a predefined threshold, an automated alert would fire, dragging an on-call engineer into a late-night troubleshooting session.
While this basic approach served the industry well during the era of monolithic applications and predictable server architectures, it has fundamentally broken down under the weight of modern software design. Today’s applications are hyper-distributed, running across dynamic containers, sprawling Kubernetes clusters, multi-tenant cloud services, serverless functions, complex microservices architectures, and third-party APIs. A single user-facing click can trigger a cascade of dozens—sometimes hundreds—of internal service calls. In this environment, simply knowing that something is broken is no longer enough; engineering organizations must instantly understand why it broke, where the failure originated, and what downstream dependencies are currently impacted.
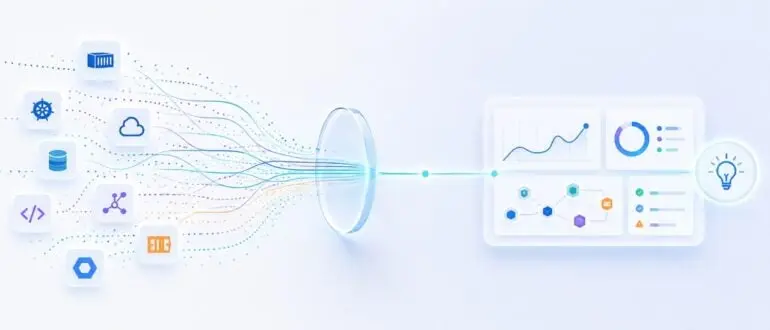
This realization has driven a massive paradigm shift across the software industry: the evolution from passive monitoring to active observability. Driven by open-source initiatives like OpenTelemetry, the integration of artificial intelligence (AI), and the unique demands of Large Language Model (LLM) agents and CI/CD pipelines, observability is redefining how DevOps and engineering teams interact with codebases. This report investigates the structural shifts propelling this transformation, analyzing how modern enterprises are moving past alert fatigue, taming data costs, and trading endless dashboard staring for genuine systemic understanding.
Detailed Chronology: From Static Thresholds to Dynamic Insight
To understand how the software industry arrived at the current observability movement, it is necessary to trace the historical trajectory of system oversight and the compounding complexity that forced its hand.
Phase 1: The Monolithic Era and Reactive Thresholds
In the early days of enterprise software, systems were largely monolithic. Applications resided on dedicated physical servers or predictable virtual machines. Monitoring tools were designed to answer binary questions: Is the server up? Is memory exhausted? Is disk space running low?
Engineers established static thresholds—such as triggering an alert if CPU usage exceeded 80% for five consecutive minutes. While effective for known failure modes, this approach suffered from a severe limitation: it only worked when teams could anticipate where and how a system would fail. If a novel bug emerged, or if an outage stemmed from an untracked interaction between subsystems, traditional monitoring offered zero diagnostic context, leaving engineers to play forensic detective in production environments.
Phase 2: The Microservices Explosion and the Siloed "Three Pillars"
As businesses scaled, monoliths were systematically dismantled into microservices to accelerate feature delivery and improve fault isolation. However, this architectural decentralization introduced a chaotic web of inter-service communication. A failure in a single caching layer could ripple through ten downstream services, triggering an avalanche of independent alerts—a phenomenon known as alert fatigue.
During this period, the industry coalesced around the concept of the "three pillars" of observability:
- Metrics: Aggregated, numerical representations of system health over time (e.g., requests per second, error percentages).
- Logs: Immutable, time-stamped textual records of discrete events generated by applications and infrastructure.
- Traces: End-to-end recordings of a single request’s journey as it traverses multiple microservices, queues, and databases.
While these pillars provided the raw materials for investigation, they were frequently trapped in fragmented, vendor-locked toolchains. Engineers wasted valuable incident-response time manually stitching together log files, trace IDs, and metric graphs across disparate platforms.
Phase 3: The Rise of OpenTelemetry and Standardized Telemetry
Recognizing the friction caused by proprietary monitoring agents, the Cloud Native Computing Foundation (CNCF) championed OpenTelemetry (OTel). By merging the OpenTracing and OpenCensus projects, OpenTelemetry established a vendor-neutral, universal standard for generating, collecting, and exporting telemetry data.
This standardization allowed engineering teams to decouple telemetry collection from analysis tooling. Suddenly, organizations could instrument their applications once and route traces, metrics, and logs to any compatible backend. This chronological milestone marked the transition from isolated data collection to unified, context-rich system observability.
Supporting Context & Metrics: The Human and Financial Toll of Complexity
The operational friction caused by inadequate system visibility is not merely an engineering nuisance; it represents a massive financial and human capital drain on modern enterprises.
The Cost of Alert Fatigue
According to recent industry DevOps benchmarks, on-call engineers spend upwards of 35% of their working hours triaging false-positive alerts or hunting down intermittent bugs. When database degradation causes ten downstream microservices to fire independent alerts simultaneously, engineers are inundated with up to a thousand notifications for a single root cause.
This sensory overload breeds alert fatigue. Engineers inevitably tune out the noise, leading to missed critical warnings, extended Mean Time to Resolution (MTTR), and severe employee burnout. Modern observability seeks to invert this ratio by shifting the focus from raw volume to contextual correlation—grouping dependent events to isolate the single root cause amidst a sea of symptoms.
The Economics of Telemetry Storage
As systems scale, the volume of generated logs, traces, and metrics grows exponentially. Organizations frequently make the mistake of adopting a "store everything just in case" policy. Without disciplined data management, telemetry storage costs can quickly rival primary cloud infrastructure budgets.
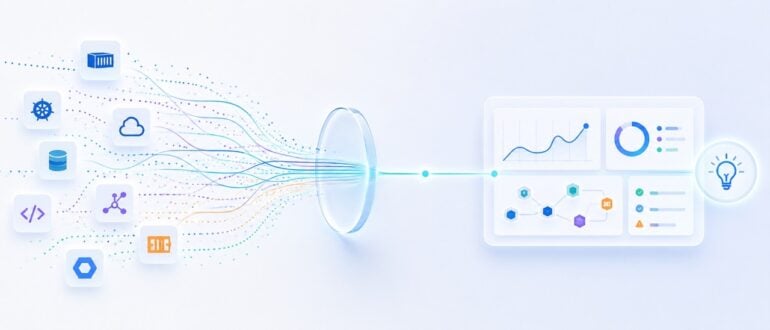
Forward-thinking DevOps organizations are establishing strict telemetry governance policies, utilizing dynamic sampling rates, defining tiered data retention windows, and ensuring that every collected byte of telemetry data maps directly to a high-value operational use case.
Official Industry Perspectives and Architectural Shifts
Industry leaders and standardization bodies emphasize that observability is no longer an optional overlay; it is a foundational architectural discipline that must be embedded throughout the software development lifecycle (SDLC).
Moving Beyond Dashboards
Traditional monitoring tools fixated on visual dashboards—static canvases displaying utilization graphs and error counters. While dashboards remain useful for high-level executive overviews, modern observability shifts the operational center of gravity from viewing charts to querying connected context.
When latency spikes in a modern observability architecture, an engineer does not merely see a rising line on a graph. They immediately access a correlated view showing:
- The exact service and code commit responsible for the regression.
- The deployment pipeline build that introduced the change minutes prior.
- The specific database query execution plan causing the bottleneck.
- The downstream dependencies impacted by the slowdown.
Shifting Left into CI/CD Pipelines
Observability practices are expanding far beyond production environments into the software delivery pipeline itself. Continuous Integration and Continuous Deployment (CI/CD) workflows are complex, distributed systems comprising source control hooks, build agents, security vulnerability scanners, artifact repositories, and container orchestrators.
When a software pipeline stalls or fails, traditional CI/CD tools offer rudimentary logs that obscure the root cause. By applying OpenTelemetry and observability standards to the delivery pipeline, DevOps teams can diagnose flaky tests, identify stalled build stages, and track performance bottlenecks across the entire software supply chain before code ever reaches production.
The AI Imperative: Taming the Black Box
The rapid adoption of Artificial Intelligence and Machine Learning workloads—particularly Large Language Model (LLM) agents—has introduced entirely new categories of system unpredictability.
Unlike deterministic microservices where a database error yields a clear stack trace, AI agents operate probabilistically. An autonomous agent might invoke multiple external tools, query vector databases, chain API calls, and evaluate model responses iteratively before failing silently or producing substandard output without triggering a traditional system error.
To debug these intelligent "black boxes," modern observability platforms now incorporate specialized telemetry hooks to track:
- Model token consumption and generation latency.
- Prompt and response payloads for safety and accuracy drift.
- External tool execution success rates and latency distributions.
Simultaneously, Artificial Intelligence is being leveraged inside observability platforms to process mountains of telemetry data. AI-powered diagnostic engines can instantly parse millions of logs, metrics, and traces during an incident, surfacing non-obvious correlations and presenting engineers with ranked, evidence-backed hypotheses regarding the root cause of an outage. However, industry experts caution that while AI drastically accelerates the investigative process, human engineering judgment remains irreplaceable when determining the business impact and safe mitigation strategy for complex production interventions.
Future Outlook: The Horizon of Observability 2.0
As software systems grow increasingly intricate, encompassing edge computing, serverless architectures, multi-cloud deployments, and autonomous AI agents, the boundary lines of enterprise technology will continue to blur.
The trajectory toward Observability 2.0 is clear. The future will not be defined by prettier dashboards or higher volumes of automated alerts. Instead, it will be anchored in the creation of a unified, living, semantic view of the entire enterprise digital ecosystem.
Key milestones on this horizon include:
- Universal Semantic Standards: Wider adoption of OpenTelemetry across every layer of the computing stack, ensuring seamless interoperability between vendors and open-source tooling.
- Proactive Remediation: Moving beyond post-incident root-cause analysis to predictive observability, where AI systems identify systemic degradation and autonomously trigger self-healing protocols before end users experience disruption.
- Holistic Business-to-Tech Mapping: Bridging the gap between technical telemetry and business Key Performance Indicators (KPIs), allowing organizations to evaluate the direct revenue impact of a microservice latency spike in real time.
Ultimately, the ultimate objective of modern observability remains steadfast: minimizing the time and cognitive load engineers waste asking, "What happened?" By replacing passive observation with deep, context-driven understanding, modern observability empowers engineering organizations to build resilient software, respond with agility, and transform production incidents into enduring architectural insights.