








Executive Overview
For the past fifteen years, the B2B software ecosystem has relied on a predictable set of gravitational laws. Startups measured their health against standardized benchmarks: the aspirational "triple, triple, double, double, double" growth trajectory, gross margins safely hovering near 80%, steady linear decay curves as companies scaled, and modest, highly efficient workforces. These metrics were the lingua franca of Silicon Valley boardrooms, governing everything from seed-stage valuations to late-stage IPO readiness.
That era has officially closed.
ICONIQ has published The Pacesetter Index, a landmark data study that completely replaces its former Enterprise Five Scorecard. Built using a specialized dataset that blends top-performing public software companies with ICONIQ’s proprietary private venture and growth portfolios from 2024 through mid-2026, the index introduces metrics that sit drastically above historical benchmarks.
Crucially, The Pacesetter Index is not a reflection of the broader market median. It is an intentional curation of outliers—specifically, companies that sit in the top quartile of revenue growth over the last three years and are classified as AI-native or AI-driven. By benchmarking against the absolute apex of modern software development, ICONIQ is revealing the new operating reality: the multiples being paid in today’s market are anchored to these stratospheric tables.
For founders, operators, and venture capitalists, understanding this index is no longer optional. It establishes the new baseline for what "exceptional" looks like in an AI-dominated economy.
Detailed Chronology: The Evolution of Software Benchmarks
To understand why the Pacesetter Index is so disruptive, one must trace the timeline of how software metrics have evolved over successive technological waves.
The Pre-Cloud and Cloud Eras (2010–2022)
During the rise of SaaS, benchmarks were characterized by predictability. Growth decay was a reliable mathematical certainty; once a company crossed $100M in Annual Recurring Revenue (ARR), achieving triple-digit growth was considered a once-in-a-decade anomaly. Gross margins were sacrosanct—anything below 75% was immediately flagged as a disguised IT services firm. Headcount scaling was linear, tethered to the traditional enterprise sales model requiring armies of account executives and customer success managers.
The Macro Shift and the AI Pivot (2023–2024)
As macroeconomic conditions tightened in 2022 and 2023, the focus shifted sharply from "growth at all costs" to capital efficiency and burn multiples. However, the simultaneous explosion of generative AI and LLM-driven applications fundamentally broke traditional financial models. Infrastructure, compute, and inference costs injected volatility into gross margins, while usage-based pricing models scrambled traditional net revenue retention (NDR) patterns.
The Arrival of the Pacesetter Era (2025–2026)
By 2026, the market split cleanly into two tiers: legacy software firms struggling to adapt, and AI-native "Pacesetters" that are rewriting the rules of corporate physics. Recognizing that traditional market medians were no longer relevant for evaluating today’s fastest-growing category creators, ICONIQ developed the Pacesetter Index. By capturing financial and operating data through Q2 2026, the index documents a reality where AI-native companies do not just grow faster—they behave differently at every single stage of their lifecycle.
Supporting Context & Metrics: Eight Core Findings
The Pacesetter Index breaks down the mechanics of hyper-growth companies across eight fundamental operational dimensions. Each metric challenges conventional wisdom.
1. 115% Growth Is the Median at $100M+ Scale
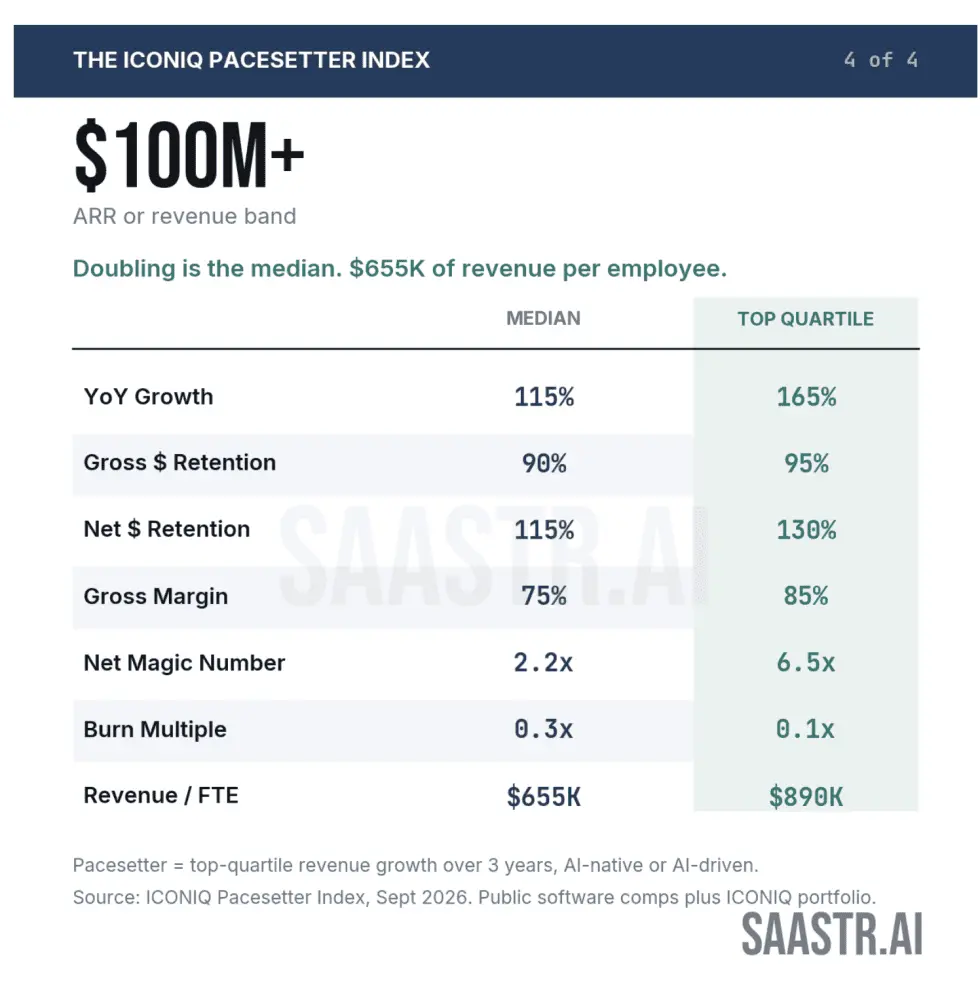
Historically, a company crossing $100M in ARR while maintaining triple-digit growth was an extreme outlier. In the Pacesetter cohort, 115% growth is the median at $100M+, with the top quartile reaching an astonishing 165%.
Even more revolutionary is the phenomenon of accelerating growth with scale. While historical growth decay curves dictated that companies inevitably slow down as they expand, AI-native businesses are landing high-volume usage and expansion revenue fast enough to bend the growth curve upward mid-lifecycle.
2. 900% Median Growth Under $10M ARR
At the earliest stages, the numbers defy traditional early-stage math. Companies under $10M ARR boast a median growth rate of 900%, with top-quartile performers hitting 2,600%. While small-number compounding plays a role, this distribution signals that early product-market fit in the AI era is translating into immediate, massive compounding velocity. The bar for being considered a "hot" seed or Series A company has shifted radically.

3. Gross Margins Start at 55%, Not 80%
The cardinal rule of SaaS—that gross margins below 75% disqualify a business—has been upended. Pacesetter companies report a median gross margin of 55% under $10M ARR, climbing to 60% in the $10M–$25M band.
Compute, API, and inference costs squeeze early margins. However, these margins recover sharply as companies scale through the $25M–$100M bracket, eventually stabilizing near historical norms as contracts are optimized and workloads mature. The board-level conversation has shifted from "Why are your margins low?" to "What is your specific roadmap to hitting 75%?"
4. Gross Retention Falls to 90% at $100M+
While net revenue retention (NDR) often captures headlines, the index highlights a critical vulnerability: median gross dollar retention (GDR) drops to 90% at the $100M+ scale.
Because switching tools is easier, sales cycles are shorter, and proof-of-concept (POC) trials are the default entry point, customer churn has accelerated. High NDR can sometimes mask a leaking customer base; businesses growing on the backs of a few expanding whales while the foundation erodes will face severe scrutiny during financial diligence.
5. Net Revenue Retention Peaks Between $25M and $100M
The median NDR trajectory across bands runs 105% → 125% → 130% → 115%.
- Under $10M, NDR is a modest 105% because early pilot programs fail to convert or expand immediately.
- Expansion peaks in the mid-market ($25M–$100M) before tapering off past $100M due to the law of large numbers and underlying gross retention leakage. Modeling flat, perpetual expansion is no longer viable.
6. Burn Multiples Deteriorate Before Improving (1.8x at $10M–$25M)
The burn multiple sequence across revenue stages is 1.3x → 1.8x → 0.9x → 0.3x.
The $10M–$25M band represents the most capital-intensive phase, where companies simultaneously fund go-to-market (GTM) buildouts and heavy AI compute before achieving operational efficiency. Beyond $25M, however, capital efficiency recovers dramatically, with top-quartile Pacesetters at scale burning just 0.1x for every new dollar of ARR.
7. $655K in Revenue Per Employee at Scale
Perhaps the most striking fingerprint of AI-era operating leverage is workforce efficiency. While traditional software companies aspired to $250K–$300K in revenue per full-time employee (FTE), the median Pacesetter at $100M+ generates $655K per employee, with top-quartile firms hitting $890K.
This operational leverage is the direct result of integrating AI agents and automated tooling into internal workflows, allowing companies to scale revenue exponentially without inflating headcount.
8. A 3.4x Magic Number at $5M ARR Is a Warning Sign
Net magic numbers display wild variance, ranging from a 3.4x median at the lowest tier (and a staggering 7.7x top quartile) to stabilizing around 1.1x to 2.2x at scale. ICONIQ warns that an exceptionally high magic number at early stages often reflects underinvestment in GTM rather than pure efficiency—a strategic misstep that many AI founders ultimately regret as competition intensifies.
Official Statements & Industry Perspectives
In analyzing the index, industry leaders emphasize the necessity of context. ICONIQ’s core rationale for structuring the index around top-quartile, AI-driven outliers is simple: to measure true excellence, modern builders must benchmark against the category creators who are actively setting market valuations, rather than settling for aggregate market medians.
As tech commentators and investment strategists note, failing to meet these Pacesetter benchmarks does not mean a company is failing. However, because venture capital and private equity valuations are increasingly tethered to these exact performance tiers, founders must be ruthlessly clear about which column of data they are being compared against.
Future Outlook: Strategic Recommendations for Your 2027 Plan
As executive teams finalize their strategic planning, the Pacesetter Index offers a clear blueprint for navigating the remainder of the decade. To remain competitive in fundraising, hiring, and execution, operators should implement four immediate adjustments:
- Put a Dated Gross Margin Recovery on the Plan: Accept that 55%–60% gross margins are normal during early AI deployment, but explicitly define the quarter and operational levers (e.g., inference optimization, pricing restructuring) that will push margins past 75% as you scale past $25M ARR.
- Track GDR Alongside NDR: Make Gross Dollar Retention a first-class board-level metric. Do not allow strong net expansion metrics to obscure underlying churn vulnerabilities in your customer base.
- Model NDR Decay Correctly: Abandon the assumption that net revenue retention remains flat indefinitely. Account for the natural peak in the mid-market and subsequent tapering at scale.
- Design Headcount Backward from Revenue-per-Employee Targets: Set a firm target for revenue per FTE at $100M ARR—using the $655K Pacesetter median as a north star—and hold every hiring decision rigorously accountable to that leverage model.
The rules of software have been rewritten. By understanding the rigorous realities of the Pacesetter Index, forward-thinking organizations can build resilient, highly leveraged businesses capable of thriving in the new era of technological acceleration.