






Executive Overview
As the United States progresses through the second half of 2026, the nation’s electric power grid finds itself at a profound technological, economic, and geopolitical crossroads. For years, energy analysts have tracked the compounding pressures of an accelerating energy transition: the explosive growth of artificial intelligence data centers, the broader electrification of transportation via electric vehicles (EVs), and the mainstream adoption of residential and commercial heat pumps. Headlines have frequently painted an apocalyptic picture of a power grid buckling under unprecedented strain.
However, a comprehensive analysis of the first seven months of 2026 energy data—compiled by the Energy Information Administration (EIA)—reveals a far more nuanced and resilient reality. While overall electricity demand has grown, it has risen by a modest 2 percent compared to the same period in 2025—down from the 3 percent year-over-year growth recorded the year prior. More importantly, the expansion of renewable energy sources, primarily wind and solar, has proven more than capable of covering this increased demand.
Despite an increasingly hostile federal regulatory environment that has stripped away key incentives and actively sought to suppress offshore wind development, green energy continues to form the backbone of the nation’s capacity additions. Wind and solar alone generated enough new power during the first seven months of 2026 to entirely offset the net increase in national grid demand. Non-carbon-emitting sources—combining renewables and nuclear power—now account for an impressive 45 percent of total US electricity production. Yet, beneath these positive generation metrics lie warning signs: solar’s breakneck growth rate is slowing, offshore wind development is facing a federally engineered bottleneck, and the shifting geography of energy storage reveals an energy sector adapting to local constraints on the fly.
Detailed Chronology: The First Seven Months of 2026
To understand the macro-trends governing the contemporary American electrical grid, industry experts typically rely on quarterly evaluations. These reports smooth out monthly weather anomalies, seasonal variations, and short-term economic fluctuations. Due to institutional delays, the release of mid-year data provides a comprehensive seven-month snapshot of 2026, mapping how the nation has powered itself from January through July.
Early 2026: The Demand Narrative vs. Reality
At the dawn of 2026, public discourse was dominated by warnings of an imminent energy crisis. The narrative centered on hyperscale data centers powering generative AI models, which were projected to consume staggering volumes of electricity. Simultaneously, the rapid transition toward electric transportation and building electrification threatened to overwhelm local distribution networks.
Yet, when the tangible data materialized, the growth in grid-level demand proved manageable. Total electricity use through July 2026 rose by just 2 percent year-over-year. Several underlying factors explain why demand has not reached hyper-inflationary levels:
- Efficiency Gains: Decades-long improvements in appliance, industrial, and building efficiency continue to suppress baseline power requirements.
- Behind-the-Meter Generation: A growing number of heavy energy users—most notably large-scale data center operators—are choosing to bypass the public grid entirely. Rather than waiting for utility interconnections, companies are installing dedicated, on-site generation infrastructure, such as high-output natural gas turbines, to power their operations directly. A notable New Jersey case earlier this year, where a data center was heavily fined after satellite imagery exposed unpermitted gas generators, highlighted how corporations are increasingly taking power generation into their own hands.
Spring to Mid-Summer 2026: Solar’s Growth Normalization
The most visible trend in American energy over the preceding half-decade has been the meteoric rise of solar photovoltaics (PV). Year-over-year growth rates frequently exceeded 30 percent, transforming solar from a niche alternative into the cheapest new source of bulk electricity generation in human history.
As mathematically inevitable as the sun setting, these astonishing percentage increases were bound to decelerate. As the total installed base of solar panels expands exponentially, adding the same absolute number of gigawatts results in a smaller percentage change. However, the deceleration observed in the first seven months of 2026 points to more than just basic math.
Through September 2025, solar generation had outpaced the previous year by 48 terawatt-hours (TWh). For the exact same seven-month window in 2026, that incremental gain dropped to 39 TWh. While this still represents a robust 22 percent year-over-year growth rate, the significant drop-off occurs at a time when national electricity demand is accelerating and solar remains the most cost-effective solution available. Analysts point directly to the macroeconomic chill cast by the federal government’s pivot away from clean energy, including the systematic dismantling or expiration of federal tax credits and production incentives that previously fueled solar’s historic expansion.
Supporting Context & Metrics: The Grid Composition
Despite headwinds, renewables have fundamentally altered the generation mix of the United States. A granular examination of the EIA data illuminates how different power sources performed during the opening months of 2026.
The Shift in Generation Sources
- Solar Power: Utility-scale solar grew by 22 percent compared to the previous year. Simultaneously, small-scale distributed solar (primarily residential rooftop installations) maintained steady momentum, expanding by over 12 percent year-over-year. Combined, utility and distributed solar produced 72 percent as much electricity as the entire US coal fleet over the first seven months of 2026.
- Coal’s Continuing Decline: Coal-fired generation dropped by slightly more than 10 percent compared to the same period in 2025. This downward trajectory reflects structural economic pressures, aging infrastructure, and strict environmental compliance costs. It has now been 13 years since the last new coal plant was commissioned in the United States, and zero coal plants are currently under development.
- Other Major Sources: Hydroelectric generation experienced a 9 percent rebound due to favorable hydrological conditions in key regions. Onshore wind power grew by 6 percent. Meanwhile, both nuclear power and natural gas generation saw marginal increases of less than 2 percent.
The Math of Net Demand and Renewable Coverage
The most striking metric of the 2026 data lies in the net balance between new demand and new renewable generation:
- Grid Demand Increase: Across the first seven months of 2026, total grid-level electricity demand rose by 51 TWh.
- Renewable Generation Increase: During that exact same timeframe, the combined growth in generation from wind and solar power totaled 55 TWh.
This convergence signifies a historic milestone: the absolute growth in wind and solar generation alone was greater than the total increase in US electricity demand over the period. Consequently, the national grid successfully absorbed the rising power needs entirely through renewable sources (excluding behind-the-meter data center generation and small-scale rooftop solar, which exist outside formal grid tracking).
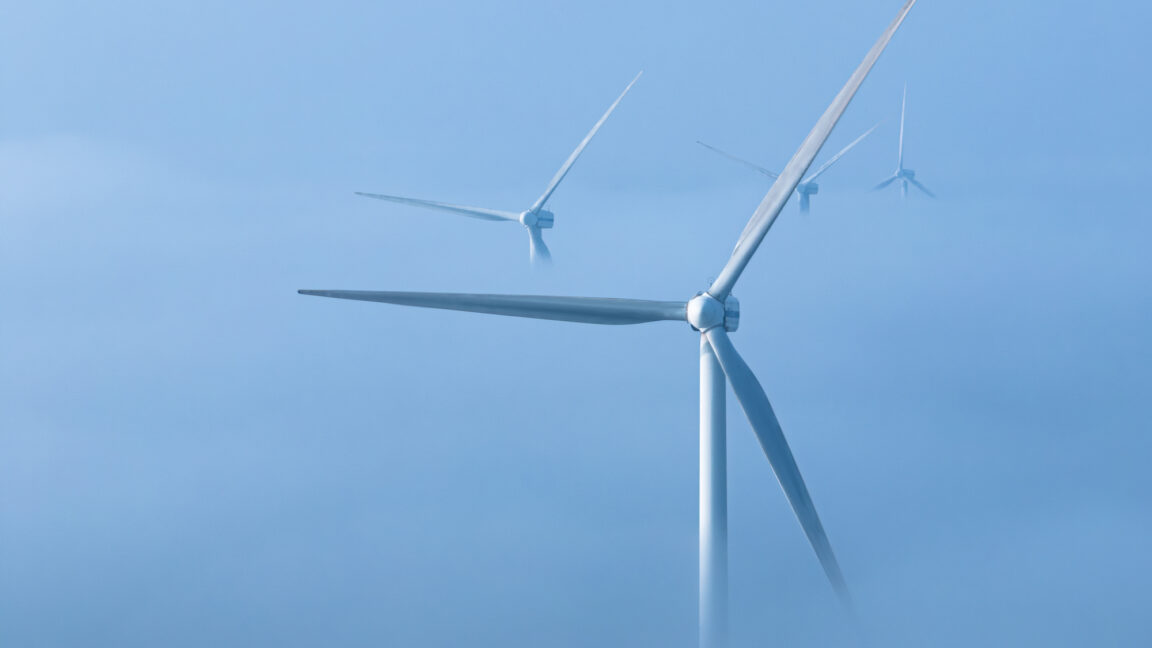
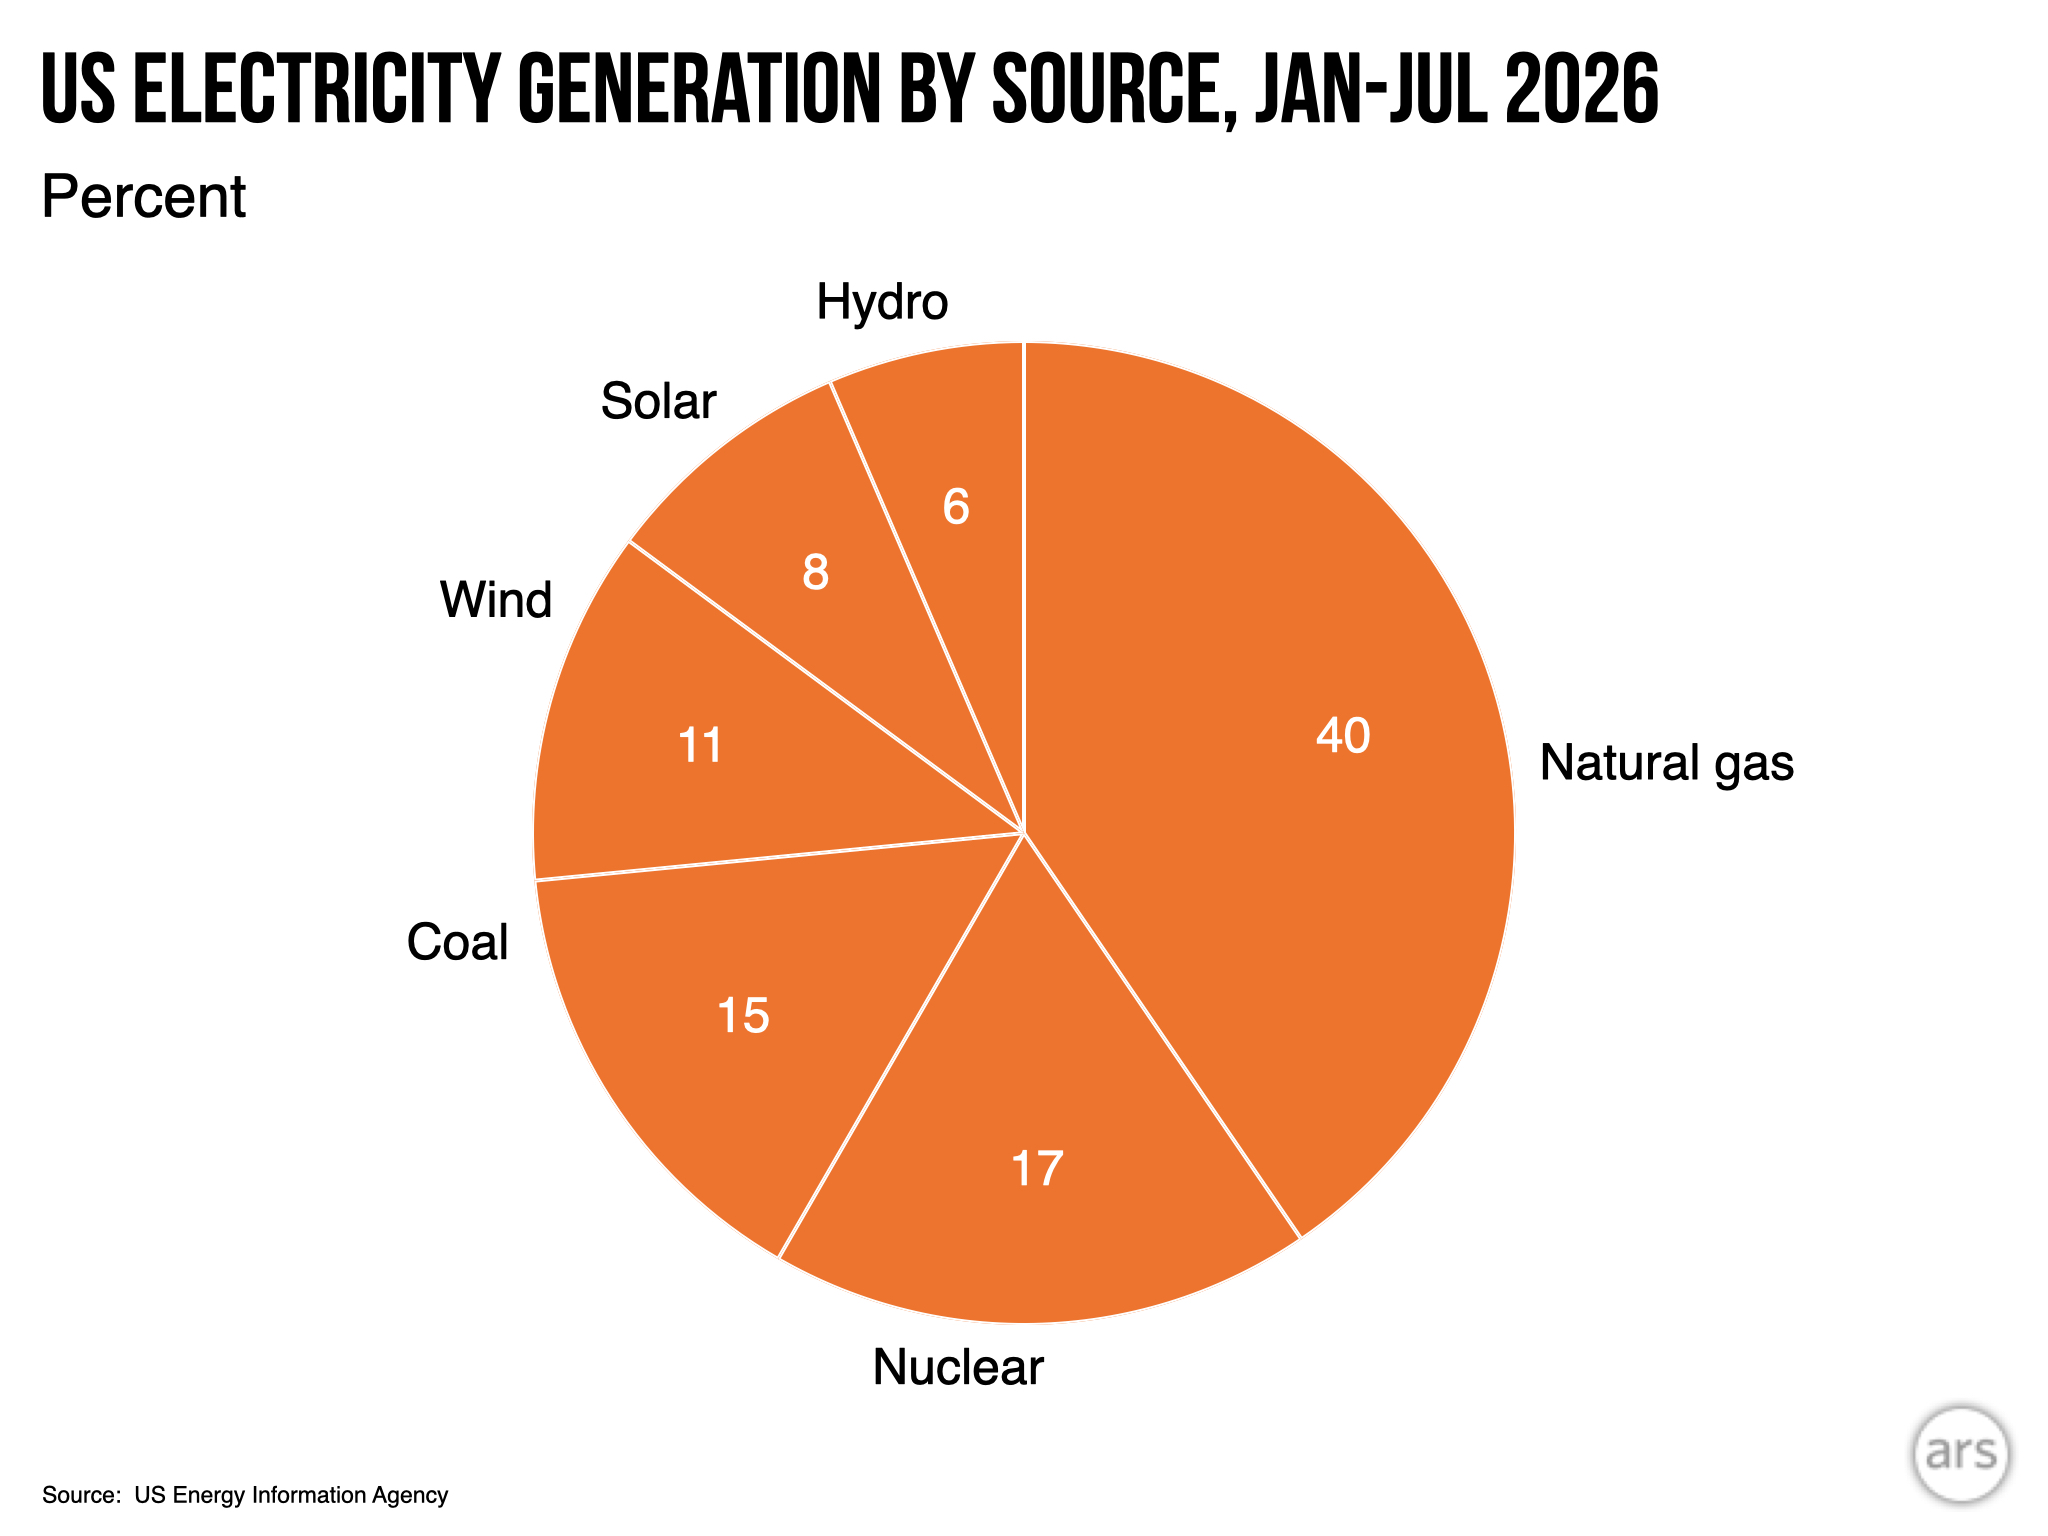
When hydroelectric generation is added to the ledger, renewables account for 27 percent of total US electricity demand. Factoring in nuclear energy, non-carbon-emitting sources collectively supply 45 percent of the nation’s electricity. For international context, the European Union currently generates roughly 30 percent of its electricity from wind and solar, with 65 percent coming from emissions-free sources (rising to 71 percent if bioenergy is included).
Official Statements and Industry Insights
The divergence between federal policy hostility and private-sector momentum has created a tense regulatory environment. Industry leaders, grid operators, and federal agencies have offered contrasting perspectives on how the system is managing these competing pressures.
The EIA Outlook and Regional Adaptations
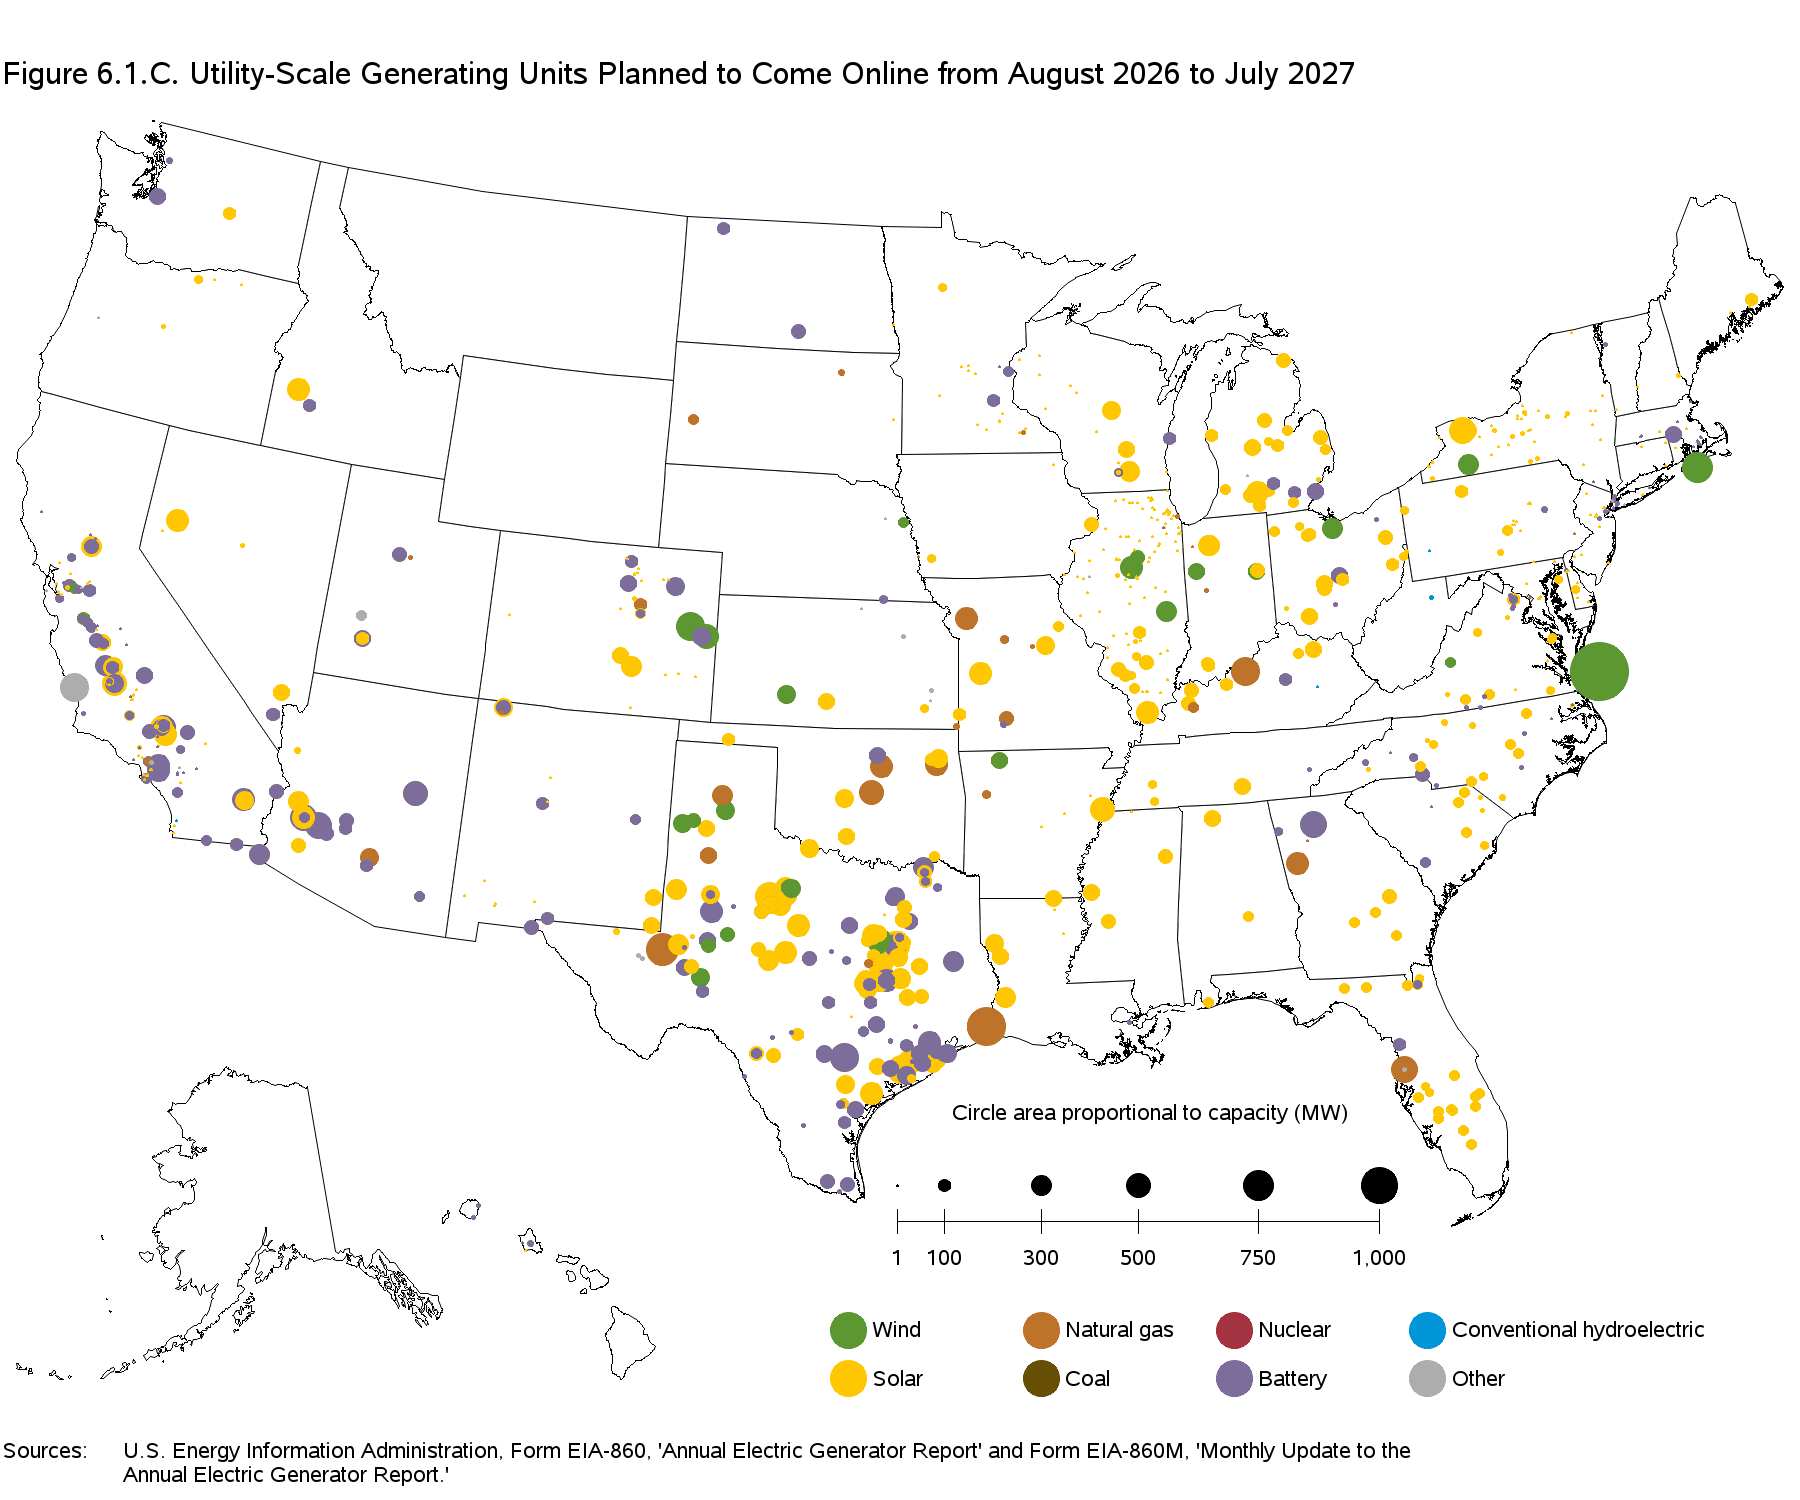
According to forward-looking data tracked by the Energy Information Administration regarding planned grid hookups, several distinct regional trends are emerging across the American landscape:
- The Onshore Wind Stronghold: While federal policy has sought to suppress coastal projects, onshore wind development continues at a steady pace across the wind-rich corridors of the Midwest and the Great Plains.
- Geographic Expansion of Solar: Solar installations are no longer confined to the traditional Sunbelt. Major utility-scale solar projects are rapidly advancing in northern states like Michigan and Wisconsin—regions where solar economics were considered unviable just a few years ago, but have now cleared financial hurdles due to plunging hardware costs and rising regional demand.
- The Battery Storage Boom: Energy storage is undergoing a geographic decentralization. While California and Texas remain the historic epicenters of grid-scale battery installations, states like Arizona, Colorado, and Georgia are aggressively deploying multi-gigawatt-hour storage systems. Michigan’s new solar farms are increasingly paired with integrated battery storage, ensuring that daytime generation can be dispatched during peak evening hours.
- Natural Gas Placements: A smattering of new natural gas-fired peaking and combined-cycle plants are slated to come online, concentrated primarily in the Midwest and Texas, serving as rapid-response capacity to back up intermittent renewables.
Future Outlook: Clouds on the Horizon for Offshore Wind
Looking toward the remainder of the decade, the trajectory of the US electric grid will be dictated by the interplay between state-level climate mandates, corporate decarbonization goals, and federal intervention.

The Offshore Wind Stalemate
The most glaring vulnerability in the long-term green transition lies in offshore wind. The EIA pipeline data highlights a brief, imminent milestone: the completion of the largest offshore wind farms in US history, highlighted by a massive 2.6-gigawatt project off the coast of Virginia, alongside another major installation in the Northeast.
However, these engineering triumphs represent a terminal peak rather than a foundation for future growth. The federal administration has aggressively utilized executive authorities and financial incentives—such as direct financial buyouts compensating developers to abandon federal offshore leases—to halt the pipeline of future maritime wind projects. Industry insiders warn that these upcoming installations will likely be the last of their kind commissioned in US federal waters until well into the 2030s.
Grid Resilience and the Path Forward
Despite federal headwinds against specific technologies like offshore wind, the foundational economics of the energy transition remain remarkably durable. Solar, onshore wind, and advanced battery storage continue to represent the most financially rational path for utilities seeking to replace aging fossil-fuel infrastructure.
As the United States navigates the remainder of 2026 and looks ahead, the core takeaway from the national grid is one of quiet resilience. The system is absorbing the pressures of electrification and data center expansion without widespread blackouts or catastrophic capacity shortfalls. By meeting 100 percent of its new demand growth through renewable generation during the first seven months of the year, the American energy sector has demonstrated that the transition toward a cleaner grid is not merely an ideological aspiration, but an operational and economic reality.