







Executive Overview
For software founders and public market investors alike, Box’s Q2 FY27 earnings report offers one of the cleanest real-world case studies on a pressing strategic dilemma: How do you take a mature, seat-priced business growing in the high single digits, rebuild its packaging around artificial intelligence, and actually move the growth needle?
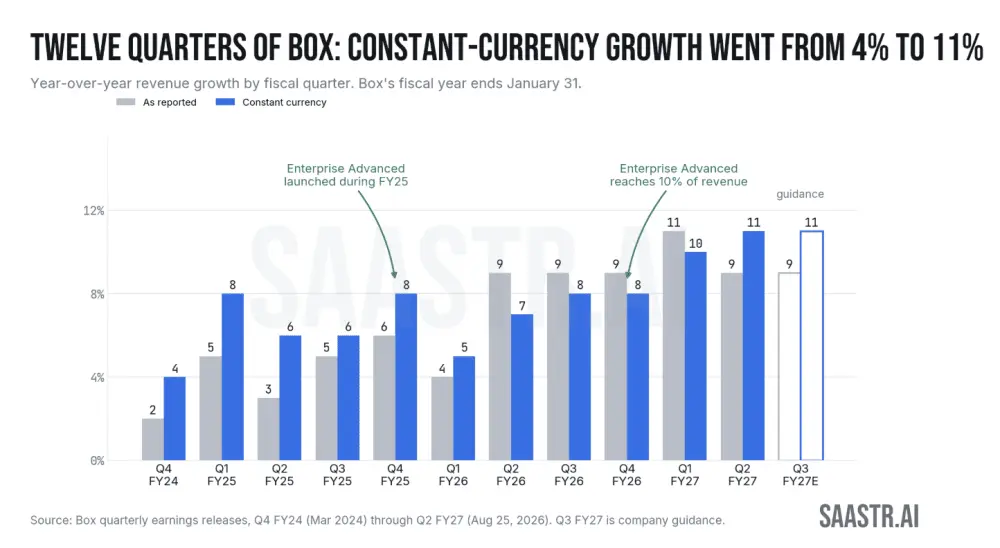
For the past eighteen months, Box has been putting this strategy to the test following the rollout of "Enterprise Advanced"—a premium tier commanding a 20% to 40% price markup over its standard Enterprise Plus offering. Now equipped with five quarters of hard data, the company’s financial trajectory paints a clear, if sobering, picture. Growth has decisively ticked upward from the sluggish single-digit baseline of previous years, yet the absolute acceleration remains modest.
Box’s performance provides a rare, transparent roadmap for navigating the complexities of AI-era monetization. By examining its billings velocity, net revenue retention (NRR), gross margin stability, and share repurchase mechanics, industry leaders can glean invaluable lessons on how to restructure legacy software models without compromising capital efficiency.
Detailed Chronology and Financial Breakdown
To understand how Box’s AI repackaging is altering its financial profile, one must look closely at the sequence in which different accounting metrics react to pricing changes. Under ratable accounting, the impact of a new pricing tier does not hit the top line immediately; instead, it cascades through the balance sheet in a predictable sequence: billings, total remaining performance obligations (RPO), long-term RPO, and finally, recognized revenue.
1. Billings and RPO: The Leading Indicators
In Q2 FY27, Box reported billings of $309.5 million, marking a 17% year-over-year increase (or 16% in constant currency). This vastly outperformed management’s "low double digits" guidance and stood in stark contrast to the meager 5% billings growth recorded just one quarter prior.
The broader forward-looking book of business corroborates this surge. Total remaining performance obligations (RPO) climbed to $1.7 billion, representing a 15% year-over-year increase (17% in constant currency). More telling is the divergence between short-term and long-term RPO:
- Short-Term RPO: Grew by 11% (14% in constant currency).
- Long-Term RPO: Grew by 18% (22% in constant currency).
This spread is the classic signature of a successful enterprise repricing under ratable software-as-a-service (SaaS) accounting. Enterprise customers are signing larger, multi-year contracts, locking in Box’s new AI-infused packages for the long haul. While Box’s recognized revenue for the quarter still largely reflects deals struck during fiscal year 2026, the billings line captures commitments made over the preceding 90 days—running a striking eight points hotter than reported revenue.
2. NRR Expansion and Capital Efficiency
Box’s Net Revenue Retention (NRR) has steadily marched upward over recent quarters, moving from 103% to 105%, and finally hitting 106% in Q2 FY27. Simultaneously, the company noted that Enterprise Advanced revenue accelerated in constant currency for the fifth consecutive quarter.
Crucially, this top-line acceleration was achieved without a parallel explosion in go-to-market spending. Sales and marketing (S&M) expenses ticked up a modest 4.4% to $106.7 million, causing S&M as a percentage of revenue to contract from 34.8% to 33.2%. By contrast, Research and Development (R&D) outpaced S&M growth, rising 9.3% to $78.4 million.
At a $1.28 billion revenue run rate, a three-point gain in NRR translates to roughly $38 million in annualized revenue acquired entirely from the existing customer base through repackaging rather than aggressive new customer acquisition or bloated sales headcount. However, context is necessary: while 106% is a solid turnaround for Box, it remains modest compared to consumption-priced models in adjacent markets, such as Snowflake, which routinely post NRR figures of 126% or higher.
Supporting Context & Metrics
Beyond the top-line figures, Box’s financial machinery reveals critical operational insights regarding gross margins, capital allocation, and currency impacts.
AI Economics: Governing vs. Consuming Tokens
One of the most striking divergences in modern software economics is how different business models absorb the surging costs of artificial intelligence inference.
Box reported a non-GAAP gross margin of 81.2% (down just slightly from 81.4%), while GAAP gross margin held flat year-over-year at 79.1%. This stands in stark contrast to software peers like Figma, whose gross margins plummeted by roughly five full percentage points in the same quarter due to heavy beta-product inference costs running against zero monetization. Similarly, Canva was forced to trim its growth forecast in part because usage controls couldn’t keep pace with raw AI demand.
Box’s secret lies in its architecture. Rather than buying and bearing the brunt of expensive model inference, Box positions itself as the secure, governed content layer that third-party AI models read from. During Q2, Box served as a launch partner for an array of advanced models—including Anthropic’s Opus and Sonnet variants, Google’s Gemini Flash series, OpenAI’s GPT-5.6, and Meta’s Muse Spark—while integrating with Model Context Protocol (MCP) agents from competitors and partners alike.
By shipping advanced agent guardrails, prompt injection detection, MCP-scoped permissions, and audit trails behind the Enterprise Advanced paywall, Box monetizes the governance of artificial intelligence. Other companies’ agents read Box’s content, and the token billing lands on the competitor’s ledger, leaving Box’s gross margins virtually untouched.
Share Repurchases and EPS Mechanics
Box’s non-GAAP earnings per share (EPS) rose 21% year-over-year to $0.40, up from $0.33, comfortably outpacing a 9% revenue growth rate. However, a significant driver of this bottom-line outperformance was aggressive capital return policy rather than organic operational leverage alone.
- Net Income: Non-GAAP net income rose 12% from $49.8 million to $55.7 million.
- Share Count: Diluted shares dropped 7.5% from 151.1 million to 139.7 million.
- Buyback Activity: Box repurchased 2.6 million shares for $66 million in Q2 (bringing first-half repurchases to $185.7 million), leaving $378 million remaining in buyback capacity.
Had the share count remained flat year-over-year, that $0.40 EPS would have registered closer to $0.37, meaning stock buybacks accounted for roughly 43% of total EPS growth. This capital return strategy came with trade-offs: cash, equivalents, and short-term investments fell to roughly $445 million from $760 million a year prior. Consequently, interest income dropped 58% to $2.8 million, now barely covering interest expenses of $2.4 million.
Official Statements and Forward Guidance
Management’s forward-looking commentary struck an optimistic yet pragmatic tone regarding the balance between top-line acceleration and bottom-line realities. Box adjusted its full-year FY27 guidance as follows:
- Revenue Guidance: Raised from $1.28 billion to $1.29 billion, shifting full-year growth expectations from 9% to 10%.
- Non-GAAP EPS Guidance: Trimmed slightly from $1.56 to $1.54 (against a Wall Street consensus of $1.58).
The reduction in EPS guidance while simultaneously raising revenue expectations raised eyebrows among analysts. Management attributed this split guidance to two primary factors: foreign exchange fluctuations (specifically the depreciation of the Japanese Yen, which accounts for a substantial portion of Box’s 35% international revenue stream) and a higher projected diluted share count. Because Box’s stock rallied roughly 36% off its April lows, a higher share price naturally pulls more options and convertible instruments into the diluted share count calculation, demonstrating the circular mechanics of aggressive buybacks during a rally.
Future Outlook
Six quarters into its Enterprise Advanced experiment, Box has proven that a mature, legacy SaaS business can successfully pivot its packaging to capture AI-driven willingness-to-pay. The ledger of accomplishments is tangible: three points of NRR expansion, an eight-point spread between billings and reported revenue growth, four points of constant-currency revenue acceleration, a 320-basis-point expansion in GAAP operating margins, and a 67% surge in free cash flow.
Yet, the broader takeaway for early-stage and growth-stage founders is operational sequencing:
- Billings and Long-Term RPO act as immediate litmus tests, validating within a single quarter whether a new pricing tier or AI packaging update is resonating with enterprise buyers.
- Gross Margins reveal instantly whether a business has successfully priced in infrastructure costs or is inadvertently subsidizing heavy AI usage.
- Net Revenue Retention takes two to three quarters to respond meaningfully.
- Reported Revenue lags behind everything else by upwards of a year—meaning executive teams must commit to roadmap and pricing changes long before the top-line numbers officially validate the strategy.
Box’s journey demonstrates that going "all-in" on artificial intelligence can indeed breathe new life into a plateaued growth curve. While the absolute acceleration from single digits to 10% may appear modest to hyper-growth tech investors, for mature B2B enterprises grappling with structural gravity, Box’s playbook offers a blueprint for sustainable, capital-efficient reinvention.