







Executive Overview
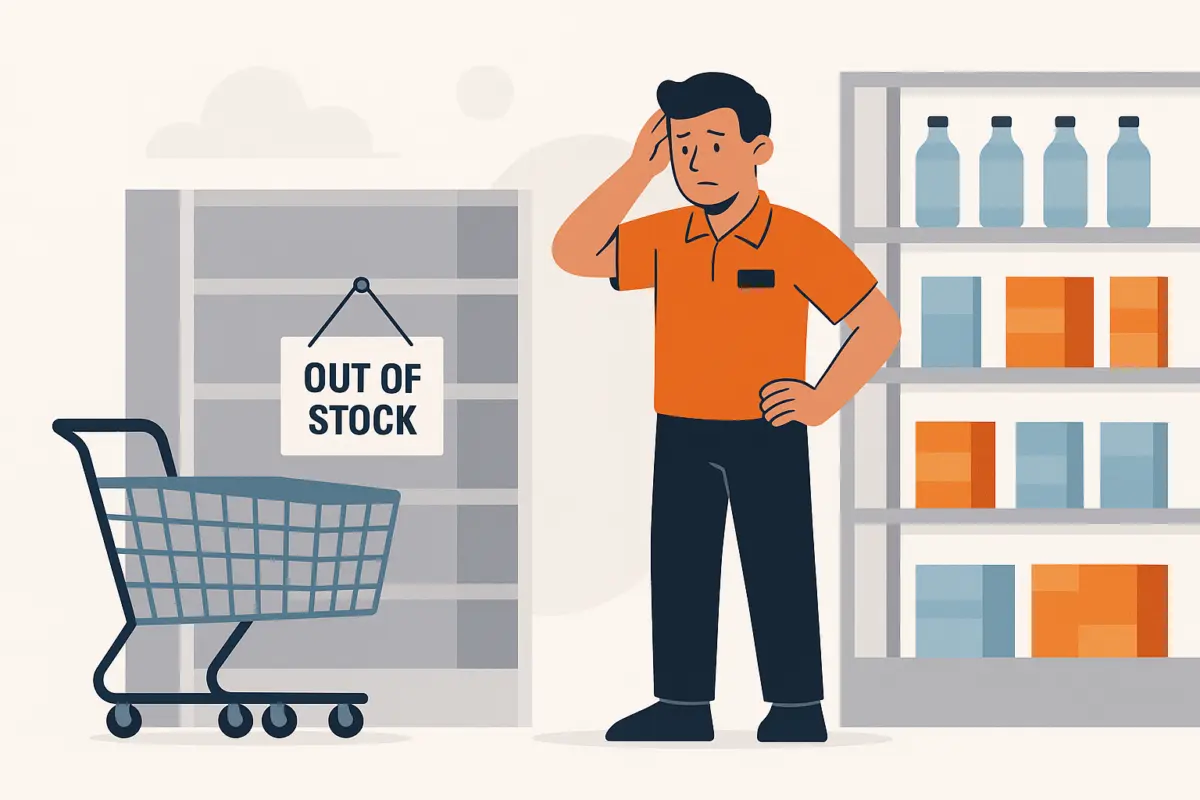
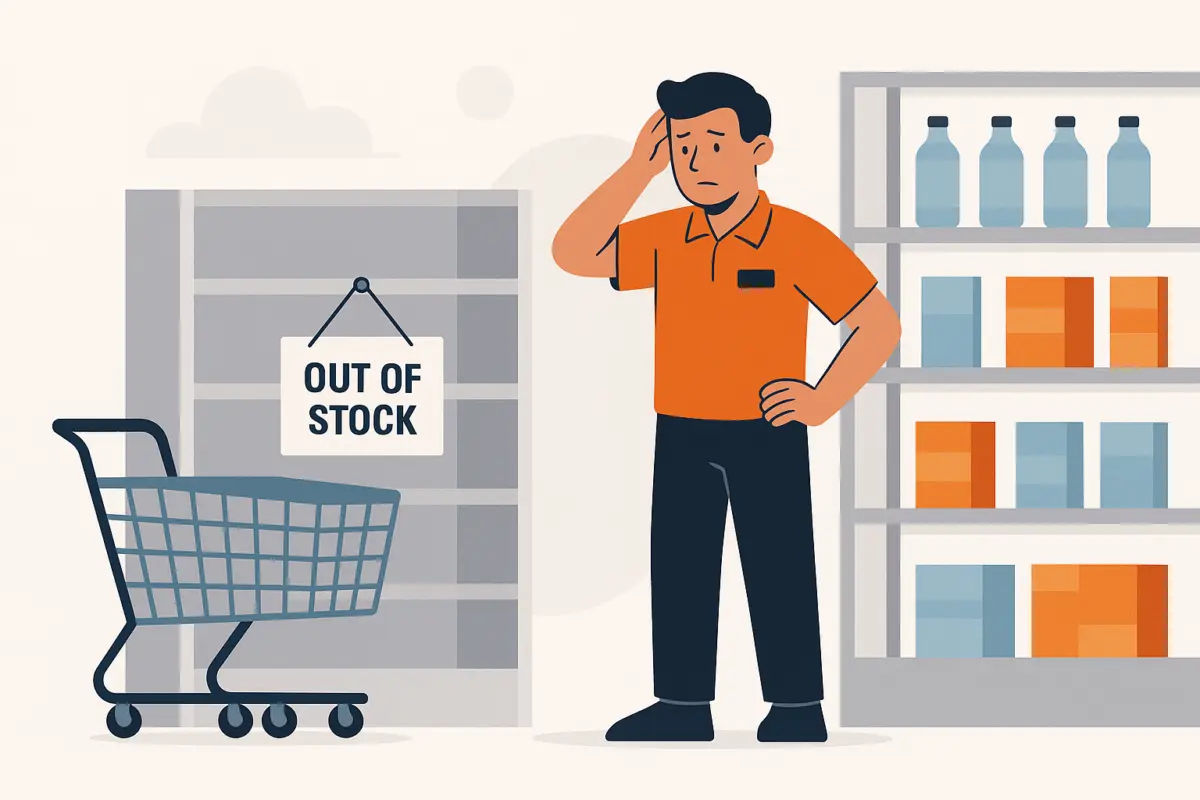
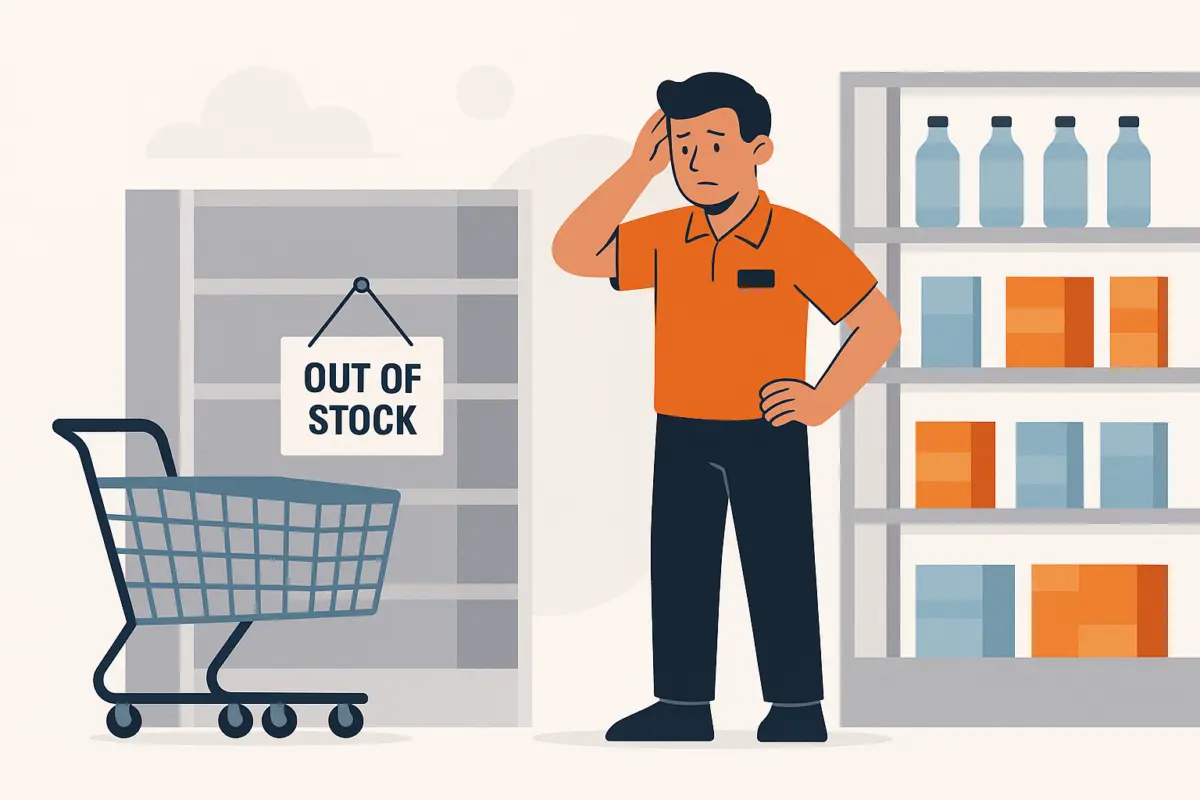
In the high-stakes ecosystem of modern retail, few metrics are as superficially comforting—and ultimately deceptive—as a clean stockout rate. Across boardrooms and weekly operational reviews, management teams routinely celebrate low overall out-of-stock percentages as proof of a well-oiled supply chain. However, according to retail analytics experts, this traditional Key Performance Indicator (KPI) is fundamentally flawed. By treating every product shortage as an equal statistical event, standard stockout counts obscure massive variations in commercial damage, hiding the shortages that actually erode customer loyalty and drain profit margins.
Recent industry data underscores the critical urgency of rethinking how inventory availability is measured. According to SPAR Group’s 2025 shopper survey, an overwhelming 74% of consumers identified product availability as their top in-store priority, while 73% pointed to out-of-stocks as the primary barrier to a positive shopping experience. Yet, when retailers rely strictly on frequency-based metrics, they fail to distinguish between the afternoon stockout of a low-volume accessory on a Tuesday and the prime-time shortage of a heavily promoted bestseller on a Saturday afternoon.
To bridge this operational blind spot, retail management teams must pivot away from blunt averages and adopt a three-tiered framework: Occurrence, Exposure, and Action. By weighting inventory shortages by expected demand, product margin, and consumer substitution behavior, retailers can transform availability metrics from passive reporting tools into proactive operational strategies. This investigative report explores why standard stockout counts fail, how omnichannel complexity exacerbates the problem, and what actionable frameworks forward-thinking retailers are implementing to protect their top and bottom lines.
Detailed Chronology: The Evolution of Inventory Blind Spots
The historical reliance on basic stockout rates stems from an era of linear, predictable retail supply chains. For decades, inventory management was treated as a localized accounting exercise: items arrived at a warehouse, were distributed to a store, and sat on a shelf until purchased. In this environment, tracking the sheer frequency of empty shelf spaces provided a manageable proxy for supply chain health.
As retail evolved through the advent of big-box discounting, localized distribution networks, and eventually omnichannel ecosystems, the limitations of frequency-based tracking became dangerously apparent.
The Shift Toward Omnichannel Complexities
The breakdown of traditional inventory tracking accelerated dramatically with the rise of unified commerce. Retailers began utilizing physical brick-and-mortar stores not just as consumer storefronts, but as localized fulfillment centers for buy-online-pickup-in-store (BOPIS) orders, ship-from-store operations, and traditional e-commerce shipping.
This operational shift fractured the traditional view of stock availability. A single Stock-Keeping Unit (SKU) could simultaneously appear as "in stock" on an enterprise dashboard while being completely inaccessible to a physical shopper because those units were physically segregated in the backroom, awaiting digital pickup processing. Conversely, inventory misplaced on the sales floor became invisible to online shoppers looking for local fulfillment.
The Real-World Cost of Supply Chain Disconnects
By the holiday season of 2024, the operational dangers of untreated supply chain vulnerabilities reached a tipping point for many global brands. A prominent example highlighted by RELEX Solutions detailed how beauty retailer KICKS traced an alarming 39% of its lost sales during the Christmas 2024 trading period directly back to a single supplier.
Faced with systemic delays, KICKS had to fundamentally overhaul its supplier processes, instituting a stringent 24-hour delivery completion requirement. This decisive operational response successfully yielded a 34% reduction in lost-sales value linked to late deliveries. The KICKS case study provided the industry with a valuable diagnostic blueprint: it proved that localized, highly concentrated supply chain failures require precision diagnostics rather than broad, portfolio-wide averages.
The 2025 Shift: From Averages to Severity
Entering 2025 and looking toward the future, retail analysts have increasingly pushed back against the tyranny of the average. Research published in the Journal of Retailing further complicated the narrative surrounding fulfillment failures. Examining an omnichannel grocery operation, researchers discovered that a single unfulfilled order did not merely result in a one-off lost transaction—it systematically delayed the customer’s subsequent order timing by an average of 7.22% and resulted in depressed basket spending over time.
These empirical findings signaled a cultural shift within retail analytics. Industry leaders began recognizing that a stockout is not a static inventory event, but a dynamic catalyst that ripples through customer lifetime value, brand equity, and future purchasing behavior.
Supporting Context & Metrics: Decoding the Data Behind Stockouts
To fully grasp why traditional stockout rates mislead leadership teams, one must examine the quantitative disconnect between occurrence and economic exposure.
Frequency vs. Damage: The Math of Missed Sales
A standard stockout rate measures the percentage of time a product is unavailable over a given period. If a retailer tracks 1,000 SKUs across 50 stores, a 2% stockout rate means that, on average, 20 product-store combinations were unavailable at any given audit.
However, this metric treats a high-velocity, high-margin item with the exact same mathematical weight as a slow-moving, low-margin legacy item. Consider the following comparative scenario:
- Scenario A: A low-volume novelty item experiences a stockout on a Tuesday morning, resulting in zero actual missed customer purchase intents because no shoppers sought the item during that window.
- Scenario B: A heavily promoted, high-margin seasonal bestseller goes out of stock at 2:00 PM on a Saturday during peak foot traffic.
Both scenarios register identically as a single stockout event in a naive counting model. Yet, the commercial damage of Scenario B is exponentially higher, actively burning through expensive marketing dollars that drove customers to the store for a product that isn’t there.
Consumer Behavior and Value Leakage
When items are unavailable, how do shoppers react? Data from Salsify’s Q4 2025 Ecommerce Pulse Report provides a sobering look at consumer behavior during stockouts:
- 58% of shoppers responded to a brand out-of-stock event by purchasing an entirely different product from a competing brand.
- 33% of shoppers bypassed the retailer entirely, purchasing the desired product from an alternative domestic retailer.
These statistics reveal that a stockout is rarely contained to a single missing item; it acts as a commercial leak that drains value from the broader basket and permanently damages brand loyalty. When a consumer is forced to defect to a competitor, the lifetime value of that customer is immediately placed at risk.
| Metric / Source | Core Finding | Commercial Implication |
|---|---|---|
| SPAR Group (2025 Survey) | 74% priority on availability; 73% cite out-of-stocks as top barrier. | Product availability is the single largest determinant of in-store customer satisfaction. |
| Salsify (Q4 2025 Report) | 58% switch brands; 33% switch retailers entirely. | Stockouts drive customer churn directly into the arms of competitors. |
| Journal of Retailing (2025) | Fulfillment failures delayed next customer orders by 7.22% and reduced spend. | Out-of-stock events degrade customer lifetime value and purchasing frequency. |
Official Statements and Industry Insights
Industry leaders and supply chain experts have increasingly voiced concerns over the complacency fostered by legacy reporting dashboards. As the retail landscape becomes more competitive and margin pressures intensify, executives are calling for a complete overhaul of how inventory health is evaluated.
"Retail management teams love a clean stockout rate because it looks so decisive. It gives executives a clean, comforting number to review in a weekly slide deck. But a clean stockout rate can easily hide the shortages that cost the most retail sales."
— Retail Analytics Consulting Perspective
Supply chain strategists emphasize that traditional KPI dashboards are often "too polite," smoothing over localized catastrophes with enterprise-wide averages.
"A few high-value stores, products, or trading periods can take most of the commercial pain, leaving a portfolio to sit comfortably within an availability target. The average is not incorrect; it is simply too polite to drive necessary operational change."
— Senior Supply Chain Operations Analyst
Experts argue that true inventory visibility requires shifting the conversation from passive reporting to active diagnostics. By forcing leadership teams to confront the exact commercial exposure behind every empty shelf, organizations can transition from defensive damage control to proactive inventory orchestration.
Future Outlook: Implementing the Three-Layered Inventory Framework
As retail technology matures, organizations are moving away from monolithic inventory models in favor of agile, multi-layered dashboards. To future-proof supply chain operations against escalating customer expectations and omnichannel complexities, retail leadership teams must implement a structured, three-layered approach: Occurrence, Exposure, and Action.
[ LAYER 1: OCCURRENCE ]
   └── Track stockout rates, SKU counts, and duration to measure operational frequency.
         │
         ▼
[ LAYER 2: EXPOSURE ]
   └── Calculate projected demand, product margins, and promotional impact to measure financial risk.
         │
         ▼
[ LAYER 3: ACTION ]
   └── Assign ownership, evaluate network inventory transfers, and address vendor replenishment bottlenecks.
Layer 1: Occurrence (Measuring Frequency)
Operations teams must retain familiar, foundational supply chain metrics such as stockout rates, availability percentages, and duration tracking. These metrics answer the baseline operational question: How many times were we unavailable, and how long did the disruption last? While insufficient on their own, this baseline remains vital for monitoring mechanical supply chain reliability.
Layer 2: Exposure (Measuring Commercial Risk)
Commercial and merchandising teams must overlay operational occurrence data with financial and behavioral context. This layer evaluates:
- Projected demand during the out-of-stock window.
- Product gross margins and category importance.
- Promotional status (flagging whether active marketing dollars are currently driving demand for an empty shelf).
- Estimated lost-sales exposure, serving as an analytical estimate for prioritization rather than a static accounting loss.
Layer 3: Action (Driving Operational Response)
The final layer connects insight directly to accountability. Retailers must ask targeted, diagnostic questions during operational reviews:
- Are fast-selling SKUs repeatedly driving stockouts in specific stores?
- Did inventory shortages spike immediately following a marketing promotion?
- Is excess inventory sitting idly elsewhere within the omnichannel network while local demand goes unmet?
By assigning a clear owner and a strict deadline to the highest-exposure stockout exceptions at every store-management review, retailers can ensure that inventory management transitions from a passive reporting metric into a dynamic, revenue-protecting engine.
Conclusion
The era of hiding behind clean stockout averages is coming to a close. In an omnichannel marketplace where consumer loyalty is fragile and switching costs are negligible, retailers can no longer afford to treat all inventory shortages equally. By restructuring dashboards around demand, margin, and customer behavior—and by systematically separating occurrence from exposure and action—retail management teams can safeguard their profit margins, protect their customer relationships, and secure a decisive competitive advantage.