










Executive Overview
For the past decade, deployment frequency has served as the ultimate litmus test for engineering maturity. Organizations that once crawled along on monthly or quarterly release cycles now sprint through daily, hourly, or even continuous deployments. This architectural and cultural revolution has largely delivered on its core promises: smaller, incremental changes are inherently easier for developers to reason about, catastrophic regressions can be rolled back with surgical precision, and feedback loops have compressed from weeks to mere minutes.
Yet, as engineering teams celebrate their newfound velocity, a silent, complex challenge has been brewing in production environments. While continuous integration and continuous deployment (CI/CD) pipelines have successfully optimized the art of delivering software, they have profoundly disrupted the traditional art of debugging it.
Performance troubleshooting historically relied on a set of foundational assumptions: a stable, unchanging release to use as a baseline; a well-defined, discrete change set tied to an incident; and sufficient breathing room between deployments to observe system behavior under normal operating conditions. In modern, high-velocity engineering organizations, none of these assumptions hold true anymore.
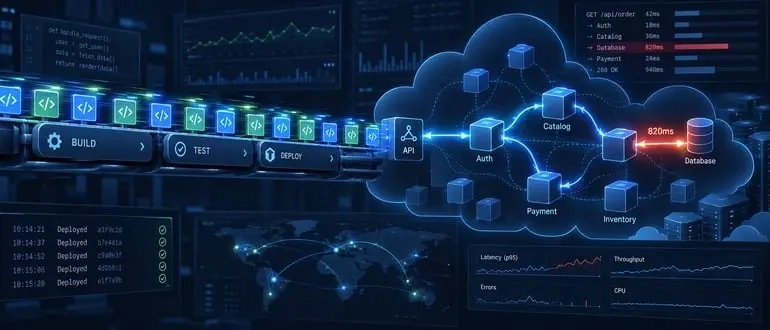
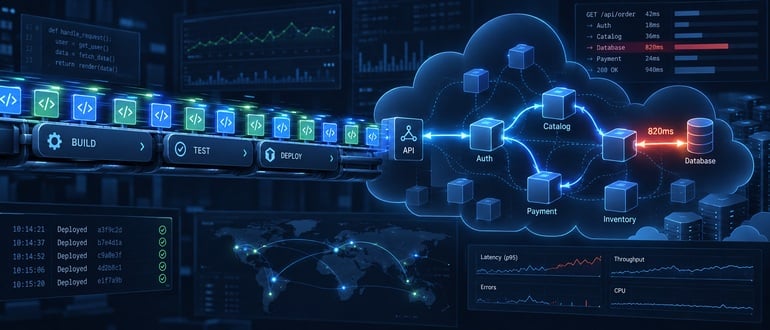
When code flows into production dozens of times a day, the baseline is constantly moving, attribution becomes a needle-in-a-haystack exercise of elimination, and delayed performance symptoms are divorced from the specific pull requests that triggered them. To prevent velocity gains from being swallowed by diagnostic paralysis, engineering leaders must recognize that delivery speed and diagnostic speed are two entirely separate metrics. Bridging this gap requires embedding runtime visibility—such as transaction-level tracing and dynamic dependency mapping—directly into the deployment lifecycle.
Detailed Chronology: The Evolution of Release Cycles and Debugging Complexity
To understand how modern engineering organizations arrived at this diagnostic bottleneck, it is helpful to trace the chronological shift in software development practices and the corresponding tools designed to support them.
Phase 1: The Era of Monolithic Stability (Pre-2010s)
In the era of monolithic applications and waterfall or early agile release models, deployments were major, highly coordinated events. Teams shipped software on a monthly, quarterly, or bi-annual cadence.
- The Debugging Paradigm: Because releases were infrequent, the production environment remained stable for long stretches. When a performance degradation occurred, engineers could safely assume that the root cause lay within the delta of the most recent release. Comparing current metrics against the previous "known good state" was straightforward.
- The Trade-off: While debugging was conceptually simpler due to isolated change sets, the changes themselves were massive. A single release might contain thousands of commits, making individual code inspection arduous and rollbacks extraordinarily risky.
Phase 2: The Microservices and CI/CD Explosion (2010s–2020)
The proliferation of cloud computing, containerization (Docker), and orchestration platforms (Kubernetes) dismantled the monolith. Microservices architectures allowed independent teams to own discrete slices of functionality and ship them autonomously.
- The Shift: CI/CD pipelines matured, transforming deployment from a high-anxiety ritual into an automated, background process. Teams moved from monthly releases to daily shipments.
- The Unintended Consequence: As deployment frequency spiked, traditional monitoring tools—built on static dashboards and periodic health checks—began to fray. Engineers realized that while they could push code faster, isolating why a specific service endpoint slowed down amidst twenty daily deployments was becoming increasingly convoluted.
Phase 3: The Continuous Delivery Present (Present Day)
Today, elite engineering organizations deploy multiple times a day across distributed, serverless, and multi-cloud architectures.
- The Current Reality: Software delivery is continuous, automated, and decoupled. However, performance debugging has hit a structural wall. The sheer volume of concurrent changes means that traditional comparative analysis—looking backward at a stable release—is mathematically and operationally obsolete. Debugging is no longer an exercise in inspecting a single change set, but a forensic investigation across a moving target.
Supporting Context & Metrics: The Mechanics of the Moving Baseline
To fully grasp the friction between rapid deployment and effective debugging, one must examine the mechanics that break down under high-frequency conditions.
1. The Moving Baseline Phenomenon
Traditional performance engineering is comparative. If latency spikes on a payment gateway, an engineer pulls up APM (Application Performance Monitoring) charts and asks: "What changed between version 1.12 and version 1.13?"
When deployments occur ten times a day, version 1.13 is a ghost town by the time the performance degradation fully manifests under peak load. By noon, the system is running version 1.15, and three minor hotfixes have been patched into the auth service.
- The Core Issue: There is no longer a single, fixed point of reference. The baseline has transformed from a stable platform into a continuous gradient. A genuine production regression is observed, but the comparative scaffolding used to isolate it has dissolved.
2. The Inverse Relationship of Attribution
There is a persistent myth that smaller changes automatically make attribution easier. While it is undeniably easier to review a 10-line pull request than a 5,000-line monolithic merge, the timeline of a bug complicates things.
- Immediate Failures: If a deployment introduces a syntax error or a null pointer exception, it fails fast. Attribution is instantaneous.
- Delayed Symptoms: Performance regressions—such as a memory leak, an inefficient database query plan triggered by accumulated table growth, or an escalating retry loop against a third-party API—often do not manifest immediately. They simmer quietly, surfacing days or weeks later under a specific traffic threshold.
When a delayed symptom finally triggers an alert, the engineer faces a sprawling candidate pool. The regression could stem from any of the dozens of microservice updates, minor dependency bumps, or modified query parameters shipped since the code path was last audited. Small changes invert the traditional trade-off: each individual change is trivial to review, but the combinatorial explosion of candidates behind a delayed symptom makes root-cause analysis vastly more complex.
Official Industry Perspectives and Expert Insights
As the DevOps community matures, industry thought leaders and engineering executives are openly discussing the hidden costs of velocity-at-all-costs.
"We spent five years optimizing our pipelines to reduce lead time from weeks to minutes," notes a Principal Infrastructure Engineer at a major fintech enterprise. "We popped the champagne when our deployment frequency crossed fifty times a day. But we quickly realized we had just traded deployment anxiety for debugging anxiety. Our developers were shipping code blindingly fast, and then spending hours digging through log aggregators trying to figure out which of the morning’s twelve microservice updates caused a database connection pool exhaustion by evening."
Observability advocates emphasize that traditional monitoring—knowing that a system is broken—is no longer sufficient. Organizations must transition to deep runtime visibility.
Industry analysts point out that enterprise productivity metrics are often skewed. Organizations measure deployment frequency, lead time for changes, and mean time to recovery (MTTR) as monolithic scores. However, MTTR itself is deceptive; it aggregates total recovery time, masking the reality that diagnostic time is expanding even as deployment execution time shrinks.
Future Outlook: Realigning Delivery Speed and Diagnostic Speed
The divergence between how fast we ship software and how fast we diagnose its flaws is unsustainable. Solving this paradox requires a deliberate, architectural shift in how engineering teams approach observability.
Treating Runtime Visibility as a Deployment Prerequisite
Historically, observability has been treated as an afterthought—something bolted on after an application has scaled, experienced a major outage, or accumulated enough technical debt to warrant a dedicated tooling budget.
In a high-frequency deployment model, runtime visibility must be treated as an innate property of the code itself. Transaction-level tracing, structured logging, and dynamic dependency mapping should be provisioned automatically as part of the CI/CD pipeline. If a service is deployed without comprehensive tracing instrumentation, its deployment should be considered incomplete.
Shifting from Elimination to Direct Observation
Modern debugging cannot rely solely on the process of elimination—guessing which deployment broke the system and rolling back blindly. Instead, engineers must leverage transaction-level visibility to start their investigations at the runtime level.
A high-fidelity trace cuts through the noise of constant deployments. It reveals precisely which method, database query, or downstream API call consumed execution time for a specific, lagging user request. It does not matter whether that slow query was introduced in deployment #4 or deployment #14; the trace points directly to the pathology within the transaction.
Similarly, automated dependency mapping is critical in rapidly shifting architectures. Because services are constantly redeployed, split, or refactored independently, static architectural diagrams are obsolete before they are published. Real-time dependency mapping ensures that engineers understand the actual, live topology of their systems, enabling them to trace cascading failures across moving boundaries.
The Role of Comprehensive Observability Platforms
To bridge the gap between rapid delivery and diagnostic speed, organizations are increasingly turning to unified application observability solutions. Platforms designed for modern cloud-native environments—such as those offering robust distributed tracing and real-time environment visibility—empower teams to maintain situational awareness no matter how fast their CI/CD pipelines churn.
For engineering leaders looking to evaluate their own diagnostic readiness, exploring advanced tooling is a vital step. Solutions like ManageEngine OpManager Nexus provide critical capabilities in application observability and distributed tracing, helping teams demystify runtime behavior. Organizations can evaluate these capabilities firsthand through offerings like a 30-day free trial of OpManager Nexus, allowing them to test deep transaction-level visibility directly within their high-velocity development environments.
Conclusion
Deployment frequency is a powerful metric of engineering agility, but it tells only half the story. Shipping software at lightning speed is meaningless if every performance regression turns into an archaeological dig through dozens of daily change sets. By decoupling delivery speed from diagnostic speed, recognizing the reality of the moving baseline, and baking transaction-level tracing and application observability directly into the deployment lifecycle, engineering organizations can finally reconcile the tension between moving fast and knowing why.