







Executive Overview
The American electrical grid is undergoing its most profound structural transformation since the widespread electrification of the 20th century. A granular examination of the power plants that recently came online across the United States reveals a definitive shift away from legacy fossil-fuel dominance and toward a decentralized, renewable-first architecture. While public imagination is often captured by massive, high-profile infrastructure projects, the real story of the current energy transition is being written by an army of small- and mid-scale solar installations, increasingly paired with advanced battery storage systems.
According to recent data tracking utility-scale grid additions, renewable energy sources and battery storage are not merely complementing traditional generation; they are comprehensively outpacing it in both project frequency and operational deployment. Utility-scale solar leads the national scorecard by a wide margin, supported heavily by utility-scale battery deployments designed to smooth out the intermittent nature of renewable generation. Meanwhile, traditional fossil fuels—specifically natural gas—tell a tale of two timelines. While vast amounts of combined-cycle natural gas capacity remain in development pipelines, very few of those massive projects have actually crossed the finish line. Instead, the gas sector is currently dominated by smaller, peaking combustion turbines and internal combustion engines designed to respond rapidly to peak demand rather than supply continuous base load.
Geographically, this expansion is far from uniform. The American Southwest has emerged as the undisputed epicenter of this generation boom, with just three states—Texas, New Mexico, and Arizona—accounting for approximately half of the entire country’s newly added generating capacity. Texas, true to its independent energy ethos, leads the charge with a unique, highly diversified generation mix that heavily leverages battery storage to manage its notorious grid volatility.
As policymakers, utility operators, and market analysts grapple with surging electricity demand driven by data centers, electric vehicles, and industrial reshoring, the data provides a clear roadmap of how the U.S. grid is evolving to meet the challenge. This report dives deep into the metrics, the regional dynamics, and the expert analyses defining the modern American power sector.
Detailed Chronology and Project Breakdown
To understand the trajectory of the modern power sector, one must examine the specific types of generation facilities that successfully transitioned from development pipelines to active commercial operation. The quantitative breakdown of recently completed projects highlights a clear preference for speed, modularity, and rapid deployment.
When categorized by the sheer number of individual operational projects, natural gas technologies still maintain a visible footprint, though their nature has evolved. Natural gas combustion turbines led the fossil fuel category with 22 newly operational projects, closely followed by natural gas internal combustion engines accounting for 21 projects. These installations are generally smaller, highly flexible assets designed to kick in during periods of high grid stress or sudden generation shortfalls.
Conversely, onshore wind projects accounted for nine newly operational facilities across the country. While fewer in number, these wind installations tend to be physically massive, capturing sprawling swaths of land to generate substantial gigawatt-hours of electricity. A prime example includes massive undertakings like the SunZia wind and transmission projects, which significantly skewed wind capacity metrics upward despite having a lower overall project count.
The most striking anomaly in the project count data involves combined-cycle natural gas facilities. Despite commanding massive amounts of announced capacity currently sitting in various stages of engineering, permitting, and construction, only three combined-cycle natural gas plants successfully went online during the tracking period. Industry analysts note that this is not indicative of a permanent abandonment of gas, but rather a reflection of construction timelines. The high tide of new, large-scale combined-cycle gas plants—engineered for high efficiency and base-load support—simply will not arrive for another few years due to long lead times, supply chain constraints, and regulatory review processes.
Supporting Context and Metrics: Capacity vs. Project Count
Analyzing the U.S. power grid purely by the number of completed projects can be deceptive. A small peaking engine and a massive utility-scale solar farm both count as "one project," yet their contributions to the grid’s total megawatt (MW) capacity are vastly different. When the data is evaluated through the lens of nameplate generating capacity, the dominance of renewables and storage becomes starkly apparent.
The Capacity Leaderboard
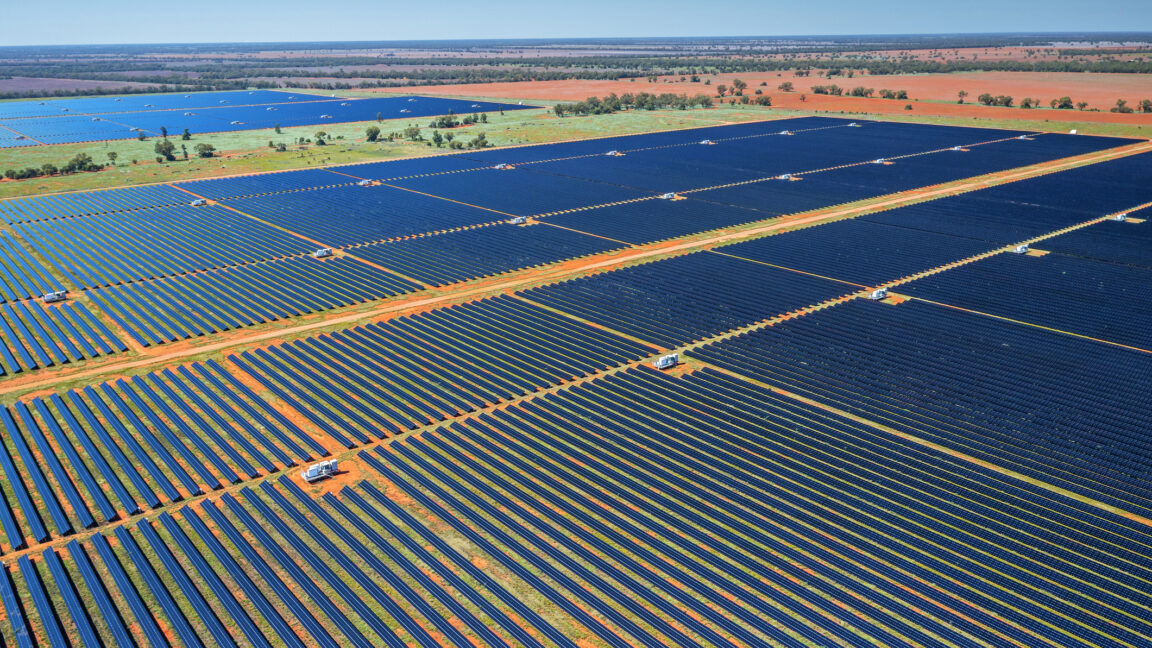
- Utility-Scale Solar: Led the nation with an imposing 11,458 megawatts of newly operational capacity.
- Battery Energy Storage Systems (BESS): Secured the second-position with 8,207 megawatts, demonstrating that storage is no longer an experimental asset class but a mandatory grid component.
- Onshore Wind: Claimed the third spot with 5,473 megawatts, bolstered heavily by high-capacity regional transmission-linked developments.
- Natural Gas (Combined): The three largest types of natural gas plants (combined-cycle, combustion turbines, and internal combustion engines) collectively added a total of 2,707 megawatts of new capacity—roughly a quarter of the capacity added by solar alone.
It is equally important to contextualize what is missing from these datasets. Small-scale distributed generation—most notably residential and commercial rooftop solar panels—is not captured in this specific utility-scale database. If rooftop solar installations were factored into the equation, the total contribution of solar energy to the American energy diet would be even more staggering.
Furthermore, analysts frequently emphasize a perpetual caveat when comparing these capacity numbers: power plant technologies possess fundamentally different operating characteristics.
- The Intermittency Factor: Solar panels and wind turbines are variable energy resources. Solar generation drops to zero at night, and wind speeds fluctuate unpredictably.
- The Capacity Factor Differential: Many natural gas peaking plants run for only a few days or weeks out of the entire year—specifically reserved for extreme weather events or moments of unprecedented peak electricity demand—whereas solar and wind strive to capture fuel whenever it is freely available.
Consequently, 11,458 megawatts of solar capacity does not deliver the exact same generation profile as 2,707 megawatts of natural gas. However, the rapid integration of batteries (8,207 MW) is specifically designed to bridge this gap, capturing excess midday solar generation and discharging it during evening peak hours.
Official Statements and Expert Analysis
To contextualize these monumental shifts in generation, industry experts point toward underlying market forces that dictate why developers are choosing specific technologies and locations.
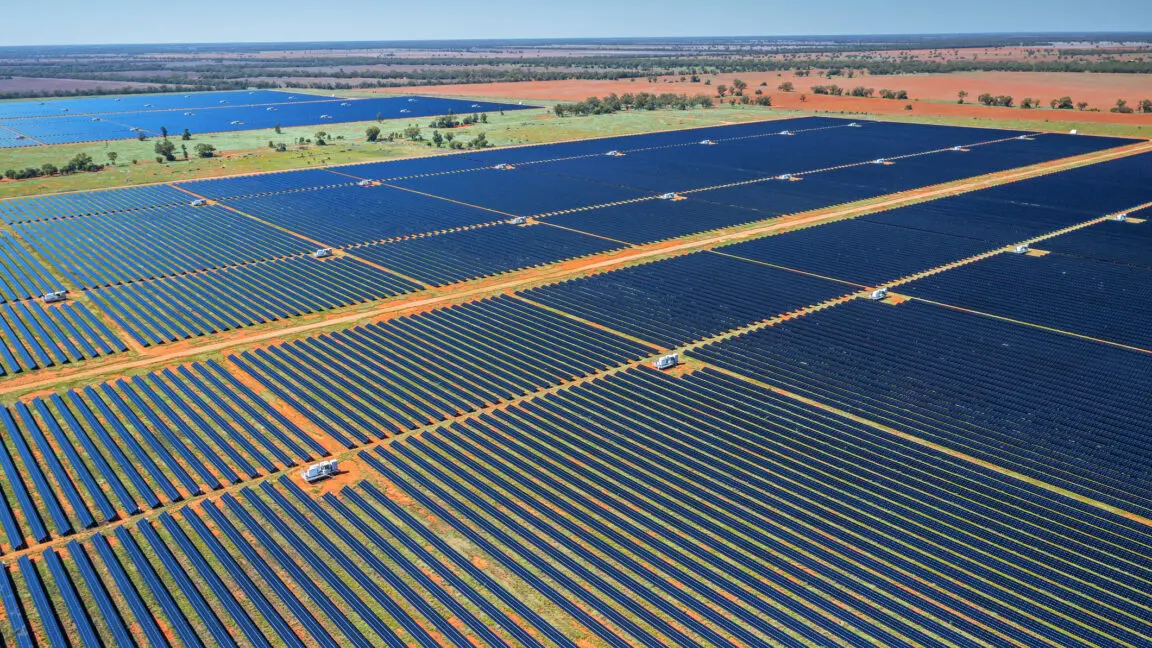
Eric Gimon, a senior fellow at Energy Innovation, a prominent San Francisco-based energy and environmental think tank, offered vital perspective on the granular nature of these capacity additions. According to Gimon, the vast majority of new projects skew toward small- and mid-size utility-scale solar installations. While these projects rarely command national headline attention, their proliferation is ubiquitous. Crucially, a large percentage of these solar installations are now being constructed as hybrid facilities—explicitly paired with on-site battery storage from day one.
"These kinds of smaller-size projects are just easier to build, and the site possibilities are much more diverse and easy to find," Gimon explained, highlighting the logistical and financial hurdles associated with mega-projects that require years of transmission planning and complex environmental reviews.
By keeping project footprints manageable, developers can navigate local permitting processes more efficiently, interconnect to distribution or sub-transmission lines with fewer delays, and bring revenue-generating carbon-free electrons to market faster. This modularity has become the ultimate competitive advantage in a power market racing against surging load growth.
Regional Dynamics: The American Southwest Powerhouse
While renewable energy expansion is occurring nationwide, geographic concentration remains one of the most defining characteristics of the current energy transition. When looking at where these new power plants were built, the data reveals a striking geographic consolidation: just three states account for roughly half of the entire country’s newly added generating capacity.
Leading this elite trio is Texas, followed closely by New Mexico and Arizona. Together, these Southwestern states represent the frontier of modern American grid engineering.
Texas: A Unique, Fuel-Diverse Frontier
Texas stands out not just for the volume of its additions, but for the eclectic nature of its generation mix. Operating within its largely isolated grid managed by the Electric Reliability Council of Texas (ERCOT), the state leans more heavily on a combination of battery storage and natural gas than many of its western neighbors, alongside a massive influx of utility-scale solar.
A breakdown of Texas’s recent capacity additions underscores this pragmatic, all-of-the-above approach:
- Battery Energy Storage: Led the state’s additions with 3,067 megawatts, highlighting the urgent commercial need for fast-acting response assets to manage wind and solar volatility on the deregulated market.
- Utility-Scale Solar: Secured the second position with 2,311 megawatts, rapidly expanding the state’s daytime clean energy footprint.
- Natural Gas (Turbines & Internal Combustion): Added 1,154 megawatts, proving that even in a state witnessing a renewable boom, fossil fuels are still actively deployed to guarantee reliability against extreme heatwaves and sudden industrial demand spikes.
Meanwhile, states like New Mexico and Arizona are leveraging vast tracts of sun-drenched federal and private land, alongside optimal wind corridors, to host utility-scale renewable projects that export power across interstate transmission lines to neighboring load centers in California and the broader Western Interconnection.
Future Outlook
The data covering recently completed power plants provides a definitive snapshot of a grid in transition, but it also serves as a prologue to the decade ahead. The sheer volume of solar and battery storage crossing the finish line validates the economic competitiveness of these technologies. Wind energy, while facing occasional siting and supply chain headwinds, continues to anchor massive regional transmission corridors.
At the same time, the relatively low output of newly operational combined-cycle natural gas plants should not be misconstrued as the death of gas. Rather, it represents the front edge of a massive development pipeline. As power demand accelerates due to the rapid expansion of artificial intelligence data centers, manufacturing reshoring, and widespread electrification of transport and heating, grid planners are confronting unprecedented capacity requirements.
In the coming years, the "high tide" of new, heavy-duty gas plants will inevitably arrive to provide the ultimate backstop for grid security. However, they will enter a power market that looks radically different from the one built at the turn of the century. It is a market where solar and batteries set the pace, flexibility is prized above all else, and the geographical center of American energy generation has firmly shifted to the sun-soaked plains of the Southwest.