






Executive Overview
For business leaders and customer experience (CX) executives navigating the hyper-hyped landscape of generative artificial intelligence, a central, trillion-dollar question remains: Exactly how many support and related issues can AI agents really, truly resolve today?
Marketing brochures and vendor homepages frequently promise near-total automation, painting a futuristic picture where human intervention is reduced to an absolute rarity. However, the gap between commercial promises and operational reality has long been obscured by proprietary metrics, synthetic datasets, and controlled vendor demonstrations.
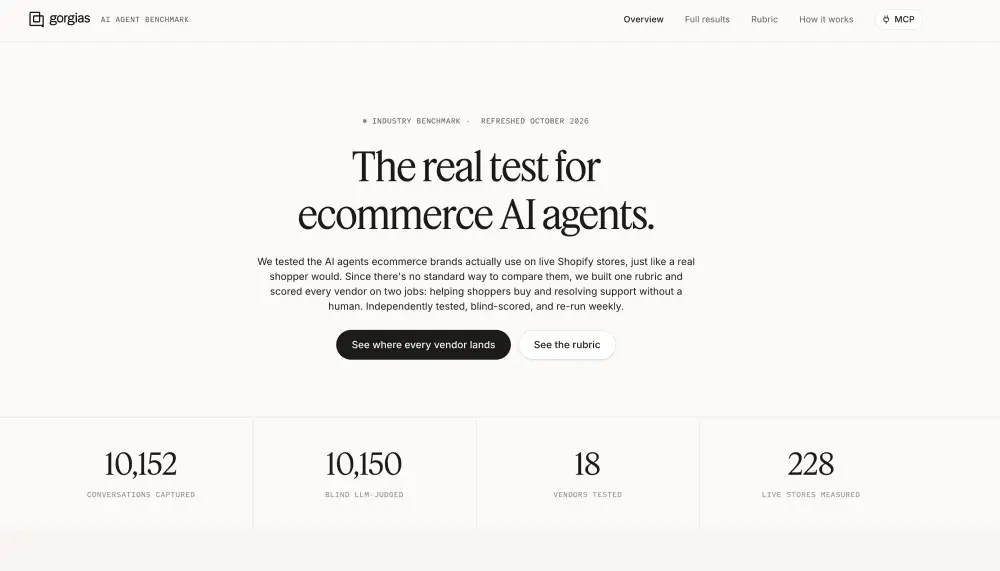
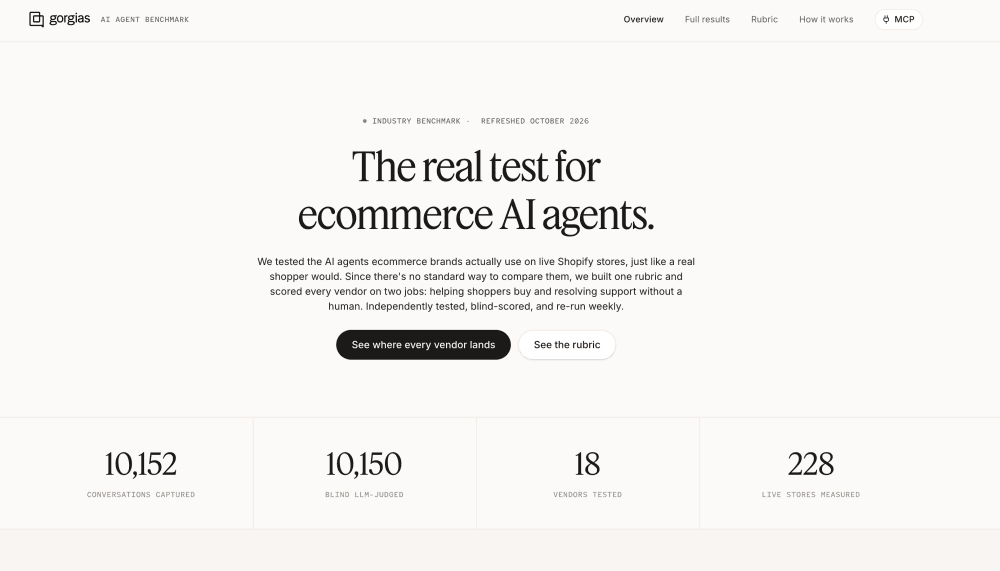
That fog is finally clearing. Gorgias, an e-commerce CX leader boasting $100 million in Annual Recurring Revenue (ARR)—with seed backing from the SaaStr Fund—has published a rigorous, transparent public benchmark. The evaluation tests 13 artificial intelligence vendors across 212 live, mid-market e-commerce stores carrying real inventory. Crucially, this study discarded sandboxes, synthetic product catalogs, and cherry-picked vendor demos. Every participating agent faced identical customer messages, with responses evaluated blind by a judge against 26 distinct binary checks. Factual claims—such as dynamic pricing, intricate return policies, and specific Stock Keeping Units (SKUs)—were verified programmatically against live store databases.
The resulting takeaway is both sobering and illuminating: The absolute best-performing AI agents fully resolve roughly 70% of customer conversations without human touch. Meanwhile, the typical vendor resolves fewer than half.
Furthermore, the data delivers an uncomfortable truth for major legacy software providers: AI tools bundled natively into established platforms like Zendesk, Intercom, and Klaviyo rank among the weakest options available, struggling to cross the 42% resolution threshold. As enterprises budget heavily for autonomous customer service solutions, this benchmark offers a vital reality check on deployment expectations, pricing definitions, and the hidden traps of automated support.
Detailed Chronology: How the Benchmark Was Built and Tested
The genesis of this comprehensive evaluation stems from a persistent industry-wide demand for objective, production-grade performance metrics. Historically, evaluating AI customer service tools meant relying on pilot programs where vendors could meticulously engineer constraints to showcase peak performance.
The Methodology
To eliminate bias, Gorgias structured the benchmark around live operational conditions:
- Real-World Environment: The test harness deployed agents directly onto 212 active mid-market e-commerce sites. There were no fake databases or simulated checkout flows.
- Standardized Inputs: Every vendor agent received the exact same incoming customer messages, representing genuine buyer inquiries, pre-sale questions, and post-purchase complaints.
- Blind Scoring and Programmatic Verification: An independent judging mechanism evaluated responses blindly. Binary checks verified claims against actual store parameters, ensuring that if an agent hallucinated a 30-day return window when the store policy was 14 days, it was immediately flagged as an error.
- The Definition of "Resolved": In this benchmark, a conversation was only counted as resolved if the AI handled it with zero human touch. No handovers to human agents, no deflections to contact forms, and no "Email us" or "Call us" drop-offs. If an agent pushed a customer out of the active chat channel, the interaction was classified as unresolved.
This stringent framework exposes a massive discrepancy between how traditional analytics measure success and how this benchmark operates. In standard vendor dashboards, an interaction is often counted as "resolved" if the AI answers a query and 72 hours pass without a human stepping in. Under that loose definition, a frustrated customer who simply abandons the chat in disgust counts as a successful automation. In the Gorgias benchmark, that abandoned customer is registered as a failure.
Supporting Context & Metrics: Breaking Down the Numbers
When examining automation rates (the share of engaged conversations the AI resolved independently), the performance spread across the 13 evaluated vendors is wide.
The Top Tier vs. The Median
- The Top 5 Vendors: Average an automation rate of roughly 70%, with top performers scaling between 64% and 75%.
- The Median Vendor: Resolves just 48% of interactions.
- Volume-Weighted Field Average: Sits at 46%.
When evaluating both automation rate and blind quality scores (scored on a 0 to 100 scale), only a select few vendors successfully cleared the bar for excellence:
- The High-Performers (Strong on Both): Platforms like Yuma, Decagon, and Gorgias stand out as the sole vendors achieving automation rates above 64% alongside quality scores exceeding 65.
- High Automation, Weak Answers: Some vendors boast high closure rates while delivering substandard accuracy. For instance, Ada closes a high volume of conversations but scores 27 points lower on answer quality than top-tier peers.
- Strong Answers, Low Automation: Conversely, platforms like Sierra match industry leaders in response quality but successfully resolve fewer than half of their conversations.
The practical implications of quality weighting are significant. A ticket marked "resolved" that provides a customer with incorrect information regarding a return window inevitably triggers a secondary contact. Because follow-up tickets frequently cost more to service than initial inquiries, a vendor scoring poorly on quality is effectively generating its own future ticket volume.
The Topic-Specific Divide: Order Tracking vs. Policy Pages
The benchmark breaks down support quality by specific topic areas across the industry:
- Policy Questions: Score highest. Questions that can be answered directly from static policy pages show high resolution rates.
- System-Lookup & Judgment Calls: Score lowest. Questions requiring real-time database lookups or nuanced human judgment sit near the bottom of the performance list.
Order tracking—typically the single largest ticket category for e-commerce brands—resides near the bottom of this capability list. Across the industry, only about a third of post-sale tracking inquiries reach a successful, automated conclusion. Furthermore, order tracking scores a staggering 17 points below simple return policy inquiries. Businesses whose ticket queues are dominated by "Where is my order?" (WISMO) queries must realize that benchmark averages can heavily overestimate actual automation potential.
The 30-Day Regress Trend
Perhaps the most startling revelation in the dataset is the directional trend of performance over time. Among the ten vendors with sufficient historical tracking over a four-week window, nine experienced a decline in automation rates. Quality metrics mirrored this downward trend, with nine out of ten vendors dropping in quality scores (e.g., Ada dropping 17 points, Zendesk down 15, Sierra down 14, and Gorgias down 12).
While the benchmark does not explicitly isolate the root cause, industry analysts suggest that underlying model updates, store configuration drift, or shifts toward more complex inquiry sets could be driving the regression. Whatever the catalyst, the core takeaway for enterprises is clear: the high-water mark achieved during a vendor pilot is rarely the baseline maintained in month two of live production.
Official Statements and Industry Implications
The publication of this open benchmark has sent ripples through the enterprise software ecosystem, forcing both specialized startups and legacy giants to re-evaluate how performance is communicated to the market.
Industry veterans note that the bundling strategies of legacy platforms are facing unprecedented scrutiny. Because Zendesk, Intercom, and Klaviyo are tools that most e-commerce brands already pay for, businesses have naturally gravitated toward their native AI features for convenience. However, with none of these bundled solutions crossing the 42% resolution threshold in the benchmark, brands are discovering that convenience comes at a steep operational cost.
Furthermore, the mechanics of vendor pricing models tie directly into these metrics. For instance, the Gorgias AI Agent charges enterprises based on its definition of a billable resolution ($0.90 per resolved conversation). When "resolved" means zero human touch and verifiable accuracy, buyers are forced to calculate their Return on Investment (ROI) based on hard data rather than optimistic marketing projections.
Experts emphasize that platform onboarding, prompt guardrails, and identity checks account for the vast majority of performance variances. Two brands utilizing the exact same underlying large language model can experience wildly different resolution rates—one achieving 45% and the other hitting 70%—solely due to how meticulously the deployment, guardrails, and escalation pathways were configured.
Future Outlook: Strategic Recommendations for E-Commerce Leaders
As artificial intelligence continues to mature, enterprises can no longer afford to adopt customer service agents based on homepage promises and isolated sandbox demos. Drawing from the empirical findings of this landmark evaluation, business leaders are advised to implement a rigorous, forward-looking strategic playbook:
- Build Realistic Financial Models: Base your business case on a conservative 65% to 70% automation ceiling—and only when partnering with a proven top-five vendor. If utilizing native AI bundled into legacy helpdesks or email marketing tools, budget for a 20% to 42% automation rate.
- Evaluate Automation and Quality Simultaneously: Never select a vendor based on automation volume alone. High closure rates paired with low accuracy create downstream friction and escalate support costs. Demand transparency on both metrics using identical test corpuses.
- Audit Against Your True Ticket Mix: Map your brand’s historical ticket volume against topic-specific benchmarks. If your queues are flooded with complex order tracking and logistics issues, discount generalized industry averages accordingly.
- Conduct Cold Reference Tests: Do not trust vendor-provided case studies. Take 30 real tickets from your historical archives, open fresh incognito sessions on the live sites of the vendor’s reference customers, and audit their resolution rates independently.
- Establish Continuous Monitoring Protocols: Recognize that AI agent performance is dynamic, not static. With historical data showing that the vast majority of vendors experience performance regression over time, automated agents must be audited and re-tested on a strict, recurring schedule.
By stripping away the marketing gloss and anchoring deployment strategies in transparent, real-world data, e-commerce leaders can successfully harness the power of AI agents—transforming customer support from a recurring operational cost into a lean, accurate, and scalable competitive advantage.