







Executive Overview
For decades, retail management teams have relied on a comforting, clean metric to gauge supply chain health: the stockout rate. Decisive, easy to calculate, and universally understood, this Key Performance Indicator (KPI) offers an executive-friendly snapshot of product availability. A low percentage implies operational efficiency, while a spike triggers immediate warehouse and logistics reviews. However, according to recent supply chain insights and retail analytics research, this basic metric is fundamentally flawed.
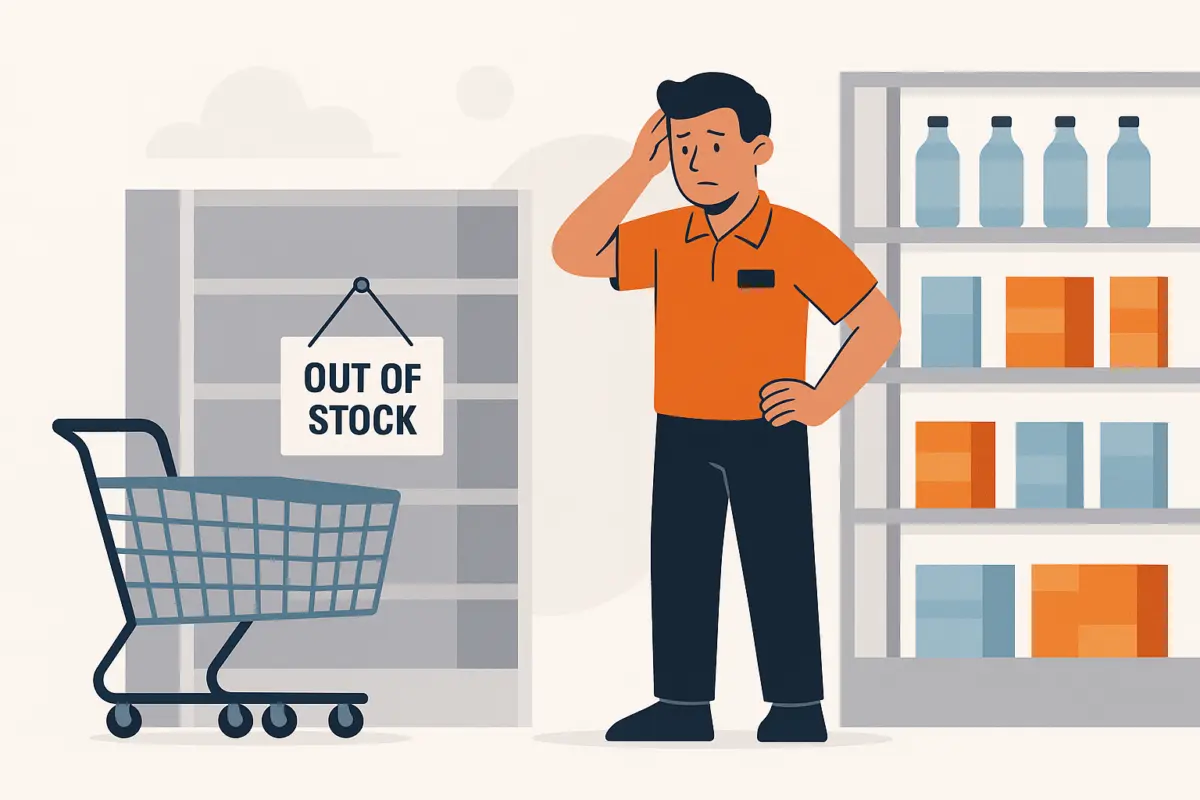
Traditional stockout counts measure the frequency of an unavailability event, completely ignoring the severity or economic damage attached to it. A stockout on a low-volume accessory at 10:00 AM on a Tuesday carries a negligible commercial footprint compared to an out-of-stock scenario on a heavily promoted bestseller on a Saturday afternoon. Yet, standard inventory dashboards treat both events with equal mathematical weight.
As modern retail evolves into a complex omnichannel ecosystem, this oversight is costing brands millions in unrealized revenue and eroding customer loyalty. According to recent data from the SPAR Group’s 2025 shopper survey, 74% of consumers identify product availability as their top in-store priority, while 73% cite out-of-stocks as the single greatest barrier to a positive shopping experience. To survive in a high-stakes, competitive marketplace, retailers must abandon the trap of relying on clean averages and shift toward a multi-layered evaluation framework that ranks stockouts by demand, margin at risk, and customer behavior.
Detailed Chronology: The Evolution of Retail Inventory Blind Spots
To understand how modern retail operations arrived at this critical juncture, it is helpful to trace the evolution of inventory management and the escalating cost of fulfillment failures over recent years.
The Legacy Era of Simple Availability Counts
For much of the late 20th and early 21st centuries, retail supply chains operated in relative isolation. Physical brick-and-mortar stores acted as self-contained silos. Inventory was shipped from a distribution center, unpacked in the stockroom, and placed on shelves.
During this era, inventory tracking was predominantly reactive. A simple binary question dominated operations: Is the item on the shelf? If yes, the product was available; if no, it was logged as a stockout. Retailers established baseline stockout targets—often aiming to keep out-of-stock rates below 2% or 3% across the board. Because profit margins were wider and digital substitution was less aggressive, this blunt instrument of measurement was "good enough" to maintain baseline operations.
The Rise of Omnichannel Complexity (2020–2023)
The retail landscape shifted dramatically during the disruptions of the early 2020s. The rapid acceleration of e-commerce, curbside pickup, buy-online-pick-up-in-store (BOPIS), and ship-from-store models fractured traditional inventory pathways. Suddenly, the same Stock-Keeping Unit (SKU) had to serve multiple, competing customer journeys.
During this period, inventory records frequently decoupled from physical reality. A unit might be registered as "on hand" in a centralized digital dashboard, but physically trapped in the backroom, reserved for a digital order, or misplaced on the sales floor. Omnichannel fulfillment failures began to compound. Retailers realized that traditional stockout rates were no longer telling the whole story; a product could look fully available in a software system while remaining entirely inaccessible to a frustrated shopper standing in the aisle.
The Crucial Turning Point: The 2024 Holiday Season
A definitive flashpoint for modern inventory analysis occurred during the Christmas 2024 shopping season. Supply chain transparency platforms and retail analytics firms began tracking the cascading financial fallout of micro-supply chain disruptions.
A prominent case study during this period involved beauty retailer KICKS. According to analytical accounts provided by RELEX Solutions regarding their work with the brand, KICKS traced an alarming 39% of all lost sales during the Christmas 2024 season back to a single upstream supplier. Rather than looking at raw stockout counts, KICKS diagnosed the specific operational breakdown: late deliveries choked off high-demand inventory during the year’s most lucrative trading window.
By implementing strict operational changes—including a mandatory 24-hour delivery completion requirement—KICKS successfully slashed its lost-sales value linked to late deliveries by 34%. This watershed moment proved that treating stockouts as isolated store-level anomalies is ineffective. Instead, retailers needed to connect inventory availability directly to upstream supplier performance and downstream revenue risk.
The Modern Shift: Toward Severity-Based Metrics (2025 and Beyond)
Entering 2025, the retail industry has reached a consensus: averages are deceptive. Landmark studies published in academic journals, such as Research published in the Journal of Retailing in 2025, alongside comprehensive industry analyses like Salsify’s Q4 2025 Ecommerce Pulse Report, have quantified the true multi-dimensional damage of fulfillment failures. Retailers are now moving away from passive stockout counts and adopting a three-tiered approach centered on occurrence, exposure, and targeted action.
Supporting Context & Metrics: The True Cost of an Empty Shelf
To properly value an out-of-stock event, retail management must account for three critical variables: expected demand, product margin, and customer substitution behavior.
1. The Multiplier Effect of Lost Demand and Margin
Treating every product-hour of unavailability as equal ignores basic economics. If a low-margin notebook is out of stock for four hours on a weekday morning, the business impact is minimal. However, if a high-margin, heavily promoted electronic device or beauty product is unavailable during peak Saturday afternoon foot traffic, the financial damage multiplies exponentially.
Furthermore, when a promoted item goes out of stock while a marketing campaign is actively running, the retailer faces a compounding loss: they are actively paying via advertising dollars to drive customer demand to a shelf that cannot fulfill it.
2. Consumer Behavior and Basket Leakage
When a customer encounters an empty shelf, their reaction determines whether the out-of-stock event is a minor inconvenience or a permanent loss of customer lifetime value. Salsify’s Q4 2025 Ecommerce Pulse Report paints a vivid picture of modern consumer intolerance for unavailability:
- 58% of shoppers stated that when their preferred brand was unavailable, they immediately purchased a different product from an entirely different brand.
- 33% of shoppers abandoned the retailer altogether to purchase the required product from a competing domestic competitor.
This behavior highlights "basket leakage." A stockout rarely affects only the single missing SKU; it often tanks the entire basket value as the shopper walks out to complete their shopping trip elsewhere. Moreover, future brand loyalty is severely compromised.
3. Long-Term Damage to Customer Frequency
The Journal of Retailing (2025) study on omnichannel grocery operations revealed an even more insidious long-term consequence of stockouts. Researchers discovered that when an online or omnichannel order failed to fulfill as expected, it did not just ruin that single transaction—it delayed the customer’s next purchase by an average of 7.22%, while simultaneously reducing their overall spending. When promoted items failed to ship, these negative financial adjustments were even more pronounced.
Official Statements & Expert Insights
Industry leaders and supply chain experts have increasingly voiced concerns over how legacy metrics distort executive decision-making.
Retail analytics consultants emphasize that modern inventory health requires contextual intelligence. As noted by industry analysts studying the KICKS and RELEX Solutions transformation, diagnosing supply chain failures requires looking past generic availability percentages:
"A reported 34% reduction in lost-sales value linked to late deliveries followed… That is a usable diagnosis: a concentrated loss, a specific delivery problem and an operational response."
Experts argue that retail dashboards must be fundamentally redesigned to stop rewarding a "good average." In a multi-store, omnichannel network, a portfolio can easily maintain a comfortable 98% overall availability rate while a handful of flagship locations or top-performing SKUs hemorrhage revenue due to chronic stockouts.
Management theorists point out that averages are simply "too polite." They obscure localized pain points and allow systemic supply chain vulnerabilities to hide behind healthy corporate averages. By shifting the conversation from reporting metrics to operational decision-making, executive teams can isolate where commercial damage is concentrated and deploy targeted interventions.
Future Outlook: The Three-Layered Framework for Modern Inventory
To eliminate blind spots and protect profit margins, retail organizations must restructure their analytical dashboards around a robust three-layer framework: Occurrence, Exposure, and Action.
[ LAYER 1: OCCURRENCE ] ──> Measures frequency, affected SKUs, and duration (Operations focus)
         │
[ LAYER 2: EXPOSURE ]   ──> Calculates projected demand, margin at risk, and promotions (Commercial focus)
         │
[ LAYER 3: ACTION ]     ──> Assigns ownership, investigates root causes, and triggers replenishment (Executive focus)
Layer 1: Occurrence (Frequency & Duration)
Operations teams still require traditional baseline metrics to maintain supply chain hygiene. This layer records:
- Total stockout rates and availability rates.
- The exact number of SKUs affected across the network.
- The duration of each unavailability event.
This layer answers the foundational question: How often is the system failing?
Layer 2: Exposure (Commercial Risk & Margin)
This layer bridges the gap between logistics and finance. Instead of treating every empty shelf equally, exposure calculates:
- Projected demand during the out-of-stock window.
- Estimated lost sales value based on historical velocity.
- Product margin and promotional status (flagging whether the item is tied to active marketing campaigns).
This layer answers the critical business question: How much money are these specific stockouts actually costing us?
Layer 3: Action (Resolution & Accountability)
Data without execution is useless. The final layer connects insights directly to store managers, supply chain planners, or vendors. Practical questions addressed in this layer include:
- Is the same store repeatedly running out of the same high-demand products?
- Is excess inventory sitting idly in another node of the omnichannel network while demand remains unmet?
- Does the issue require immediate store-level replenishment, an inventory transfer, or direct vendor intervention?
Conclusion: Shifting from Reporting to Execution
Retail management teams must stop treating stockout rates as passive report cards. By dismantling legacy league tables and replacing them with exception-based reviews focused on severity and exposure, retailers can transform inventory analytics from a historical reporting exercise into a dynamic engine of profitability. At the next store-management review, leadership should assign clear owners and hard deadlines to the highest-exposure stockouts—ensuring that fixing availability is driven not by how often a problem occurs, but by where the commercial damage hurts the most.