








Executive Overview
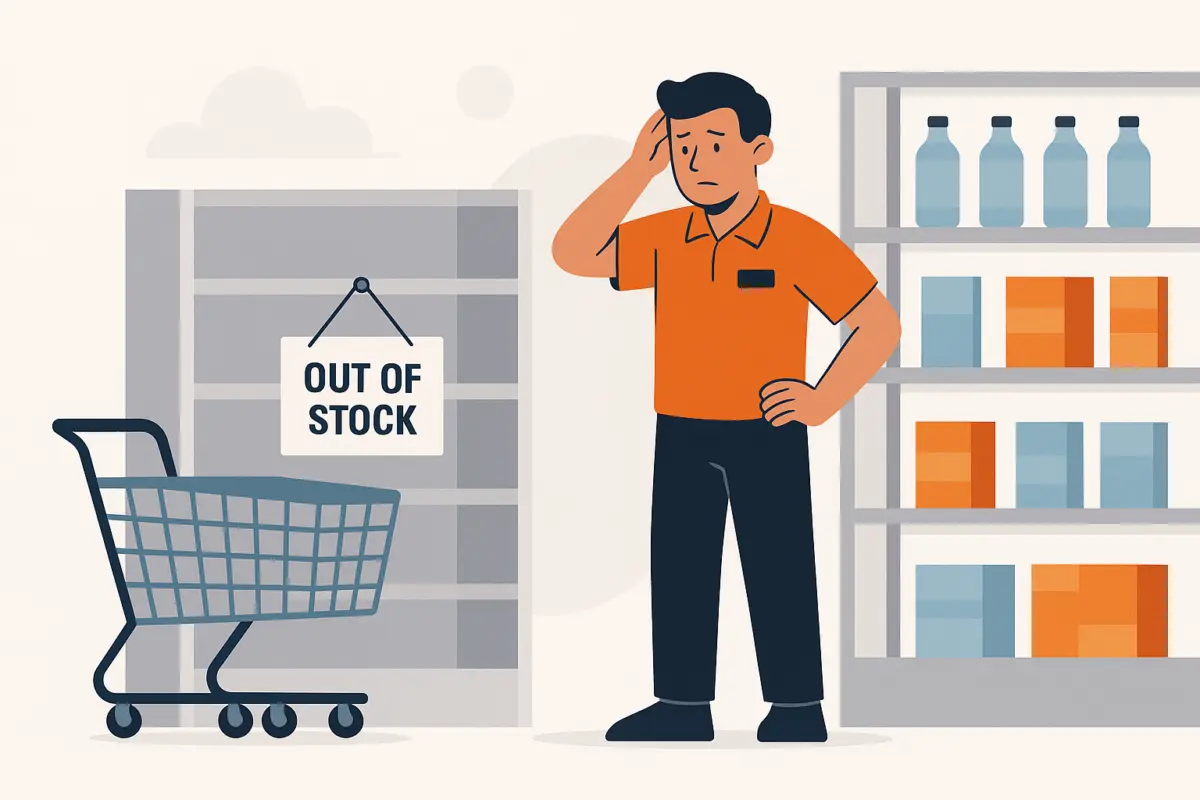
In the high-stakes theater of modern retail, few metrics are as superficially comforting—and profoundly misleading—as a clean stockout rate. For decades, retail management teams have relied on basic availability percentages to gauge supply chain health, deriving a sense of operational control from neat, decisive figures. However, a growing body of retail analytics research, inventory management studies, and frontline consumer data suggests that this reliance on raw frequency over financial severity is costing the industry billions in unrealized revenue and eroding customer loyalty.
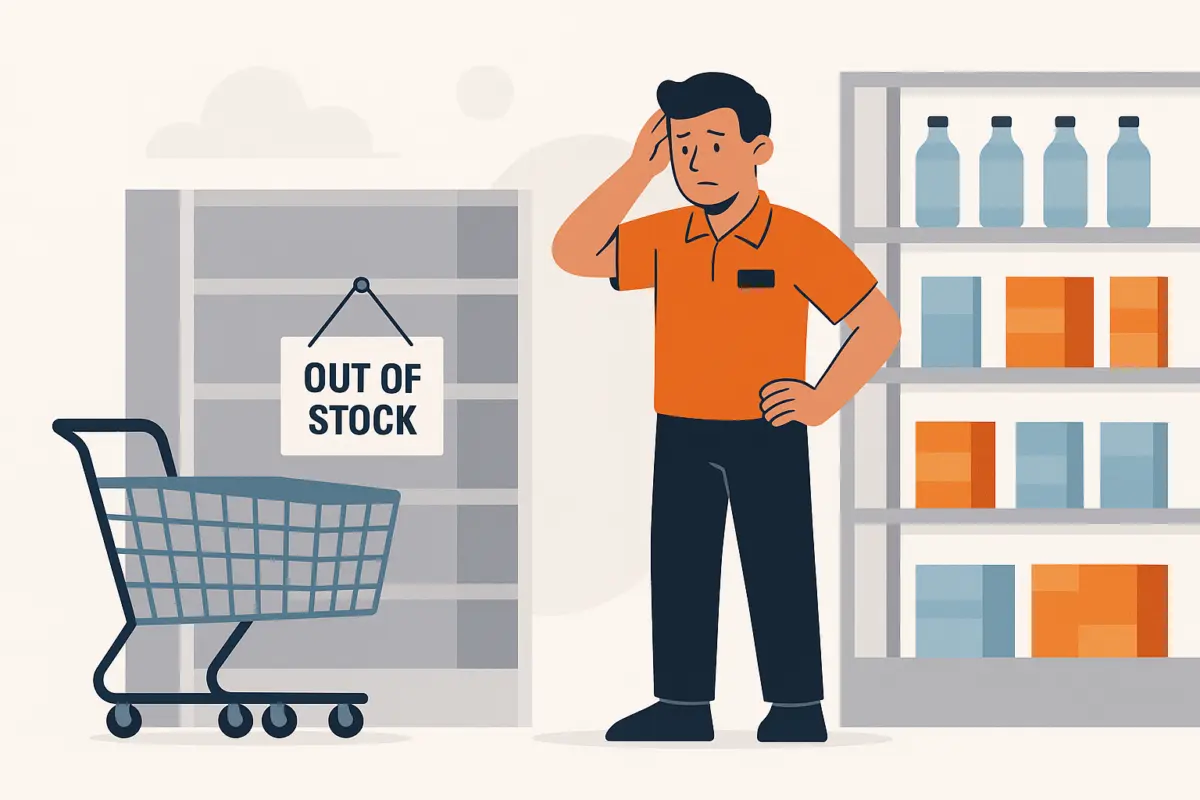
The fundamental flaw in traditional inventory key performance indicators (KPIs) lies in their egalitarian treatment of disparate events. A stockout of a low-volume, niche accessory on a quiet Tuesday morning is counted with the exact same weight as an out-of-stock crisis involving a heavily promoted bestseller on a peak Saturday afternoon. Yet, the commercial damage inflicted by these two scenarios could not be further apart.
To thrive in an unforgiving omnichannel marketplace, retail leadership must fundamentally shift how they measure and rank inventory failures. By moving away from unweighted frequency counts and transitioning toward a three-layered framework that evaluates occurrence, commercial exposure, and targeted action, merchants can align their operational fixes with actual financial risk. This investigative report explores why traditional averages mask deep-rooted supply chain vulnerabilities, analyzes how modern consumer behavior amplifies the cost of empty shelves, and outlines a practical roadmap for redefining retail availability metrics.
Detailed Chronology: The Evolution of Inventory Blind Spots
The historical reliance on basic stockout rates dates back to early supply chain management practices, where inventory tracking was largely manual and periodic. In those legacy environments, simply knowing how often a product was missing from a shelf was considered a major technological leap.
The Legacy Era: Frequency as the Sole Standard
Throughout the late 20th and early 21st centuries, retail dashboards were engineered to reward aggregate performance. If a chain-wide availability rate hovered at 95% or 98%, regional managers and supply chain directors were deemed successful. The 2% to 5% failure rate was typically written off as an unavoidable cost of doing business.
However, this aggregate view created a dangerous complacency. A retail chain could boast a pristine 98% availability rating while quietly bleeding revenue in its highest-performing urban stores during peak shopping hours. Because the metric measured sheer item-level absence over a 24/7 cycle rather than hourly demand concentration, it systematically disguised structural inventory failures.
The Omnichannel Complication
The rapid expansion of omnichannel retail over the past decade shattered the illusion of the simple stockout rate. As retailers integrated physical stores, fulfillment centers, and digital storefronts into unified inventories, the definition of "available" blurred.
A single stock-keeping unit (SKU) might register as "on hand" within a store’s inventory management system, but remain functionally unavailable to a shopper because the item was physically trapped in a backroom receiving queue, misplaced on the sales floor, or quietly reserved for a click-and-collect customer. Furthermore, shared inventory pools meant that a digital order could deplete stock earmarked for a high-margin in-store display, sparking localized stockouts that traditional brick-and-mortar metrics failed to capture.
The Breaking Point: Real-World Case Studies
Recent high-profile supply chain disruptions have forced retail executives to confront the limitations of legacy KPIs. A prime example occurred during the 2014–2024 retail cycles, culminating in major supply chain overhauls across European and North American markets.
For instance, major beauty retailer KICKS traced an alarming 39% of its lost sales during the Christmas 2024 trading period to a single supplier, according to an account published by RELEX Solutions detailing their joint transformation initiative. Rather than relying on broad stockout percentages, KICKS investigated the root cause, implemented strict supplier-process changes, and enforced a 24-hour delivery completion requirement. This granular diagnosis led to a direct 34% reduction in lost-sales value linked to late deliveries.
Had KICKS relied solely on a standard, unweighted stockout rate, the localized concentration of supplier failure might have been swallowed by the holiday season’s broad operational noise, delaying a targeted fix and compounding revenue leakage.
Supporting Context & Metrics: The True Cost of Empty Shelves
To understand why stockout measurement must evolve, one must examine the intersection of macroeconomic supply chain pressures, consumer expectations, and cross-channel purchasing behavior.
What Consumers Actually Expect
Shoppers are remarkably unforgiving when faced with product unavailability. According to SPAR Group’s 2025 Shopper Survey, an overwhelming 74% of respondents identified product availability as their top in-store priority, while 73% pinpointed out-of-stocks as the single leading barrier to a positive in-store experience. Retailers do not need to be convinced that stockouts matter; the disconnect lies entirely in whether their measurement tools accurately highlight which stockouts demand immediate intervention.
The Domino Effect of Defection
When an item is out of stock, the financial damage rarely stops at the lost margin of the missing SKU. Modern consumers have low tolerance for friction and a vast array of alternative choices.
Data from Salsify’s Q4 2025 Ecommerce Pulse Report reveals the precarious nature of brand loyalty during a stockout:
- 58% of shoppers responded to a brand unavailability by purchasing a different product from an entirely different brand.
- 33% abandoned the retailer altogether, purchasing the desired product from a competing domestic retailer.
This customer behavior demonstrates that a stockout is not merely a delayed transaction—it is an active acquisition channel for competitors. The initial missing item triggers a cascade that can forfeit the entire basket value and permanently damage long-term customer lifetime value (LTV).
Omnichannel Friction and Customer Retention
The downstream penalties of stockouts extend far beyond the immediate point of sale. Research published in the Journal of Retailing (2025) examined omnichannel grocery operations and uncovered a sobering operational reality: when an online order failed to be fulfilled as expected (such as a substitution or an unfulfilled line item), it delayed the customer’s next order by an average of 7.22%, while concurrently reducing total spend.
These spending contractions and delivery delays were particularly pronounced when promoted items failed to ship. The study underscores that an unfulfilled order alters consumer shopping rhythms, eroding the predictability of recurring revenue streams.
Official Statements and Industry Insights
Industry analysts, supply chain consultants, and retail technology experts increasingly argue that standard reporting frameworks are fundamentally misaligned with modern commercial realities.
"A clean stockout rate can hide the shortages that cost the most retail sales. Retailers love a clean stockout rate because it looks so decisive."
— Retail Analytics Consulting Insights
Experts emphasize that traditional metrics are designed to report historical operational status rather than guide proactive commercial decision-making. When management teams review weekly performance dashboards dominated by polite averages, they are often reviewing lagging indicators that mask localized crises.
Furthermore, retail operations leaders note that the introduction of automated replenishment and artificial intelligence tools in supply chains has created a false sense of security. Algorithms designed to optimize inventory levels across distributed networks can easily misinterpret demand signals if they are fed raw, unweighted out-of-stock data. Without adjusting for the margin at risk and expected demand volume, automated systems may prioritize restocking low-velocity items simply because their replenishment cycle parameters are easier to optimize, leaving high-margin, high-velocity promotional items exposed.
A New Framework: Three Layers for Actionable Inventory Management
To transition from passive reporting to active damage control, retail management teams must restructure their dashboards around a three-tier model: Occurrence, Exposure, and Action.
+-----------------------------------------------------------------+
|                  THE THREE-LAYERED DASHBOARD                    |
+-----------------------------------------------------------------+
|  1. OCCURRENCE  --> How often are we out of stock?              |
|                     (Traditional Stockout & Availability Rates) |
+-----------------------------------------------------------------+
|  2. EXPOSURE    --> What is the commercial risk?                |
|                     (Projected Demand, Margins, Promotions)     |
+-----------------------------------------------------------------+
|  3. ACTION      --> What specific operational fix is required?  |
|                     (Vendor Fix, Store Transfer, Replenishment) |
+-----------------------------------------------------------------+
Layer 1: Occurrence (Frequency Tracking)
There is still value in knowing the baseline frequency of inventory gaps. Retailers should maintain familiar supply chain metrics, such as stockout rates and general availability percentages. This foundational layer answers the basic operational question: How many SKUs were affected, and how long did each event last? It provides operations teams with a baseline pulse of supply chain reliability.
Layer 2: Exposure (Commercial Risk Assessment)
The second layer introduces financial context by evaluating expected demand and margin during the out-of-stock window. Instead of treating every unavailable product-hour equally, analytics tools must calculate:
- Projected Sales Volume: What units would have sold during the actual out-of-stock hours based on historical run-rates and seasonality?
- Product Margin: What is the gross margin contribution of the missing items? High-margin stockouts demand immediate escalation over low-margin accessories.
- Promotional Flags: Is the missing item currently backed by active marketing spend? If a retailer is paying to drive customer traffic to a promoted product that sits on an empty shelf, the financial exposure is multi-fold.
Layer 3: Action (Targeted Resolution)
The final layer connects the diagnosis directly to an operational owner. Rather than leaving a stockout statistic hanging in a weekly league table, the dashboard should drive specific questions:
- Are fast-selling items repeatedly stocking out in specific flagship locations?
- Is excess inventory sitting idly in a nearby node or regional distribution center while local demand remains unmet?
- Does the issue stem from poor supplier compliance, lagging inventory record accuracy, or delayed floor-to-shelf replenishment?
By assigning an owner and a strict resolution deadline to the highest-exposure stockouts, retail management transforms availability from a passive corporate metric into an active competitive weapon.
Future Outlook: The Road Ahead for Retail Analytics
As retail environments grow increasingly complex, the tolerance for blunt-instrument metrics will continue to diminish. The future of retail analytics belongs to systems that synthesize real-time customer behavior, predictive demand sensing, and precise commercial exposure modeling.
Over the next several years, leading retailers will likely phase out unweighted stockout reporting entirely, replacing it with dynamic severity scoring. These advanced models will automatically ingest real-time point-of-sale data, omnichannel fulfillment queues, and consumer substitution probabilities to calculate the true dollar-value risk of every empty shelf in real time.
For executive leadership, the mandate is clear: Stop rewarding a good average. A portfolio can easily hide severe localized failures behind comforting chain-wide availability targets. By dismantling polite averages, restructuring dashboards around commercial exposure, and demanding rigorous accountability for high-stakes inventory gaps, retailers can protect their top lines, fortify customer loyalty, and ensure that their shelves are stocked where it matters most.