








Executive Overview
In the high-stakes world of professional color grading, broadcast engineering, and digital intermediate production, display accuracy is not a luxury—it is an absolute mandate. For decades, achieving and maintaining reference-level calibration across a facility’s monitor fleet has been a notoriously complex, time-consuming, and expensive endeavor. It typically required specialized external computers, costly software licenses, dedicated pattern generators, and hours of manual oversight by highly trained technicians.
At IBC 2026, Flanders Scientific Inc. (FSI) systematically dismantled this traditional paradigm. By showcasing the expansion of its revolutionary GaiaColor AutoCal and GaiaColor Analyzer ecosystem to its workhorse DM Series monitors, FSI has successfully productized a complete, PC-free, on-monitor calibration and verification workflow.
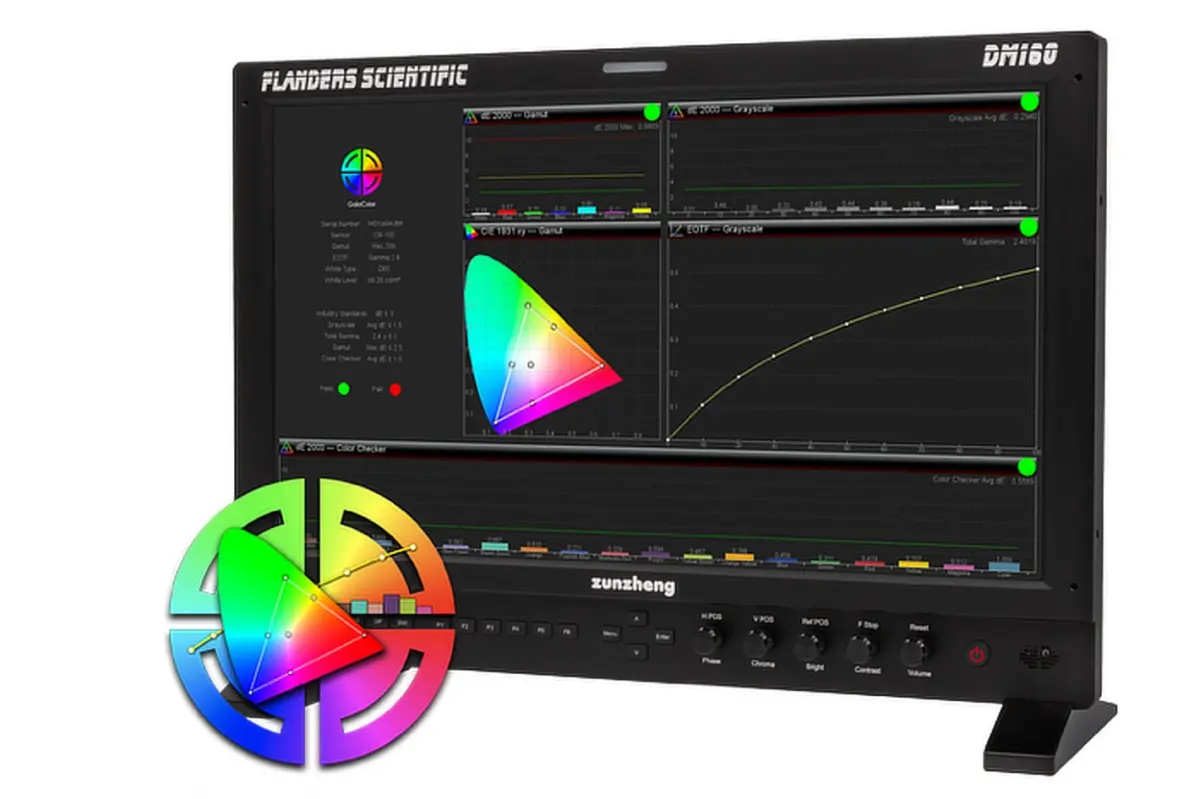
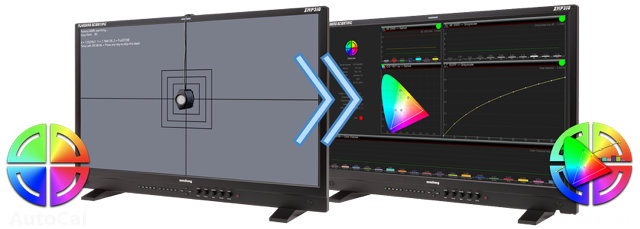
Originally developed for FSI’s flagship QD-OLED XMP and XMP C Series displays, the GaiaColor ecosystem is now accessible to the broader DM Series through a newly released, free beta firmware update. By connecting a supported hardware measurement probe directly to the monitor’s USB port, users can calibrate, verify, and generate comprehensive, audit-ready Quality Control (QC) reports in a matter of minutes—all driven by the monitor’s internal processing engine.
This move represents a major shift in color management. By democratizing automated, ultra-precise calibration and self-contained verification, FSI is setting a new standard for operational efficiency on set, in post-production suites, and across master control rooms worldwide.
Detailed Chronology: The Road to On-Monitor Autocalibration
To understand the significance of FSI’s latest firmware release for the DM Series, it is essential to trace the evolutionary timeline of display calibration technology and how FSI has systematically consolidated the calibration hardware chain.
+-----------------------------------------------------------------------------+
|                            THE EVOLUTIONARY PATH                            |
+-----------------------------------------------------------------------------+
|                                                                             |
|  TRADITIONAL METHOD                                                         |
|  [Laptop] ---> [Calibration Software] ---> [External Pattern Generator]     |
|                      |                                 |                    |
|                      v                                 v                    |
|               [Probe Reading] -----------------> [Monitor 3D LUT]           |
|                                                                             |
+-----------------------------------------------------------------------------+
|                                                                             |
|  FSI GAIACOLOR METHOD (PC-Free)                                             |
|  [Supported Probe] ------------Direct USB Connection------------> [Monitor] |
|                                                                             |
|  * Internal Pattern Generator (TPG) automates patch generation              |
|  * Internal processor calculates and saves volumetric characterization      |
|  * 3D LUTs generated on-board for all gamuts, EOTFs, and color temperatures |
|                                                                             |
+-----------------------------------------------------------------------------+
The Legacy Era of Calibration
Historically, calibrating a professional CRT, LCD, or OLED reference monitor was a fragmented process. A colorist or engineer had to connect the monitor to a computer running third-party software (such as Calman or ColourSpace). The computer also had to interface with an external test pattern generator (TPG) to feed specific color patches to the display, while simultaneously controlling a highly sensitive colorimeter or spectroradiometer positioned on the screen.
The software would compare the target color values against the probe’s physical readings, calculate corrective 3D Look-Up Tables (LUTs), and upload those LUTs back to the monitor. This workflow was plagued by potential points of failure, including HDMI/SDI signal chain interference, operating system color-space overrides, driver incompatibilities, and high licensing costs.
The Debut of GaiaColor AutoCal
Recognizing these pain points, Flanders Scientific introduced GaiaColor AutoCal. By embedding a proprietary pattern generator and calibration engine directly into the monitor’s hardware, FSI bypassed the external computer entirely.
When a compatible probe is connected directly to the display, the monitor takes control of the probe, cycles through its own internal test patches, measures its native performance, and builds a precise volumetric characterization of the display panel. This characterization is saved directly to the monitor’s non-volatile memory.
The Verification Breakthrough: GaiaColor Analyzer
While AutoCal solved the execution of calibration, studios still faced the challenge of verification. Display panels drift over time due to thermal fluctuations, backlight degradation, and component aging. To prove to clients and studio auditors that a monitor is still operating within tight tolerances, engineers had to rerun complex software-based validation profiles.
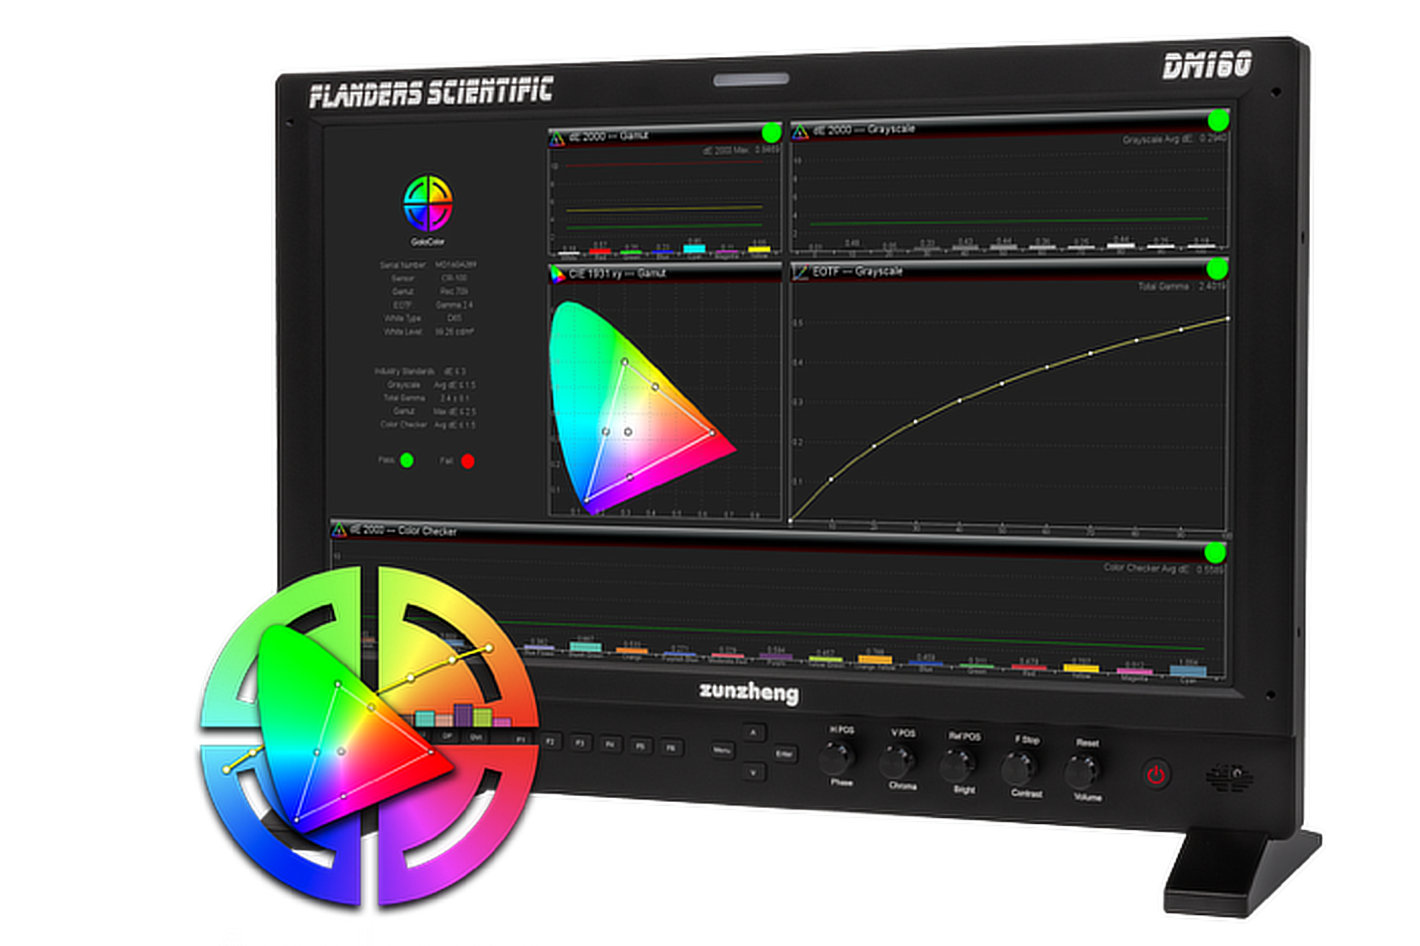
To address this, FSI developed the GaiaColor Analyzer, which made its high-profile debut at NAB 2026, where it earned the prestigious TVTech Best of Show Award. Analyzer leveraged the same PC-free hardware architecture as AutoCal but served a distinct purpose: to verify, measure, and document display performance without altering the underlying calibration data.
The IBC 2026 Expansion
At IBC 2026, FSI completed the next logical phase of its rollout. Recognizing that thousands of facilities rely on FSI’s DM Series LCD monitors alongside their newer QD-OLED displays, the company extended the GaiaColor Analyzer and AutoCal capabilities to the DM Series.
By delivering this functionality via a free beta firmware update, FSI has unified its product lines under a single, cohesive color-management platform.
Technical Deep-Dive: How AutoCal and Analyzer Work Under the Hood
The GaiaColor ecosystem relies on a sophisticated hardware-software integration inside the monitor’s main board. This process is divided into two distinct phases: volumetric calibration and objective verification.
+--------------------------------------------------------------------------+
|                       GAIACOLOR WORKFLOW PIPELINE                        |
+--------------------------------------------------------------------------+
|                                                                          |
|  [Phase 1: AutoCal]                                                      |
|  1. Connect Probe to Monitor USB                                         |
|  2. Monitor TPG Displays Native Patches                                  |
|  3. Probe Records Panel Performance                                      |
|  4. On-Board Processor Generates Volumetric Characterization             |
|  5. Multi-Mode LUTs Automatically Created (Rec.709, DCI-P3, HDR, etc.)   |
|                                                                          |
|  [Phase 2: Analyzer (Verification)]                                      |
|  1. Connect Probe & Run Analyzer Routine                                 |
|  2. 60-Second Patch Reading (No LUT Alterations)                         |
|  3. On-Screen QC Pass/Fail Report Generated                              |
|  4. PDF Exported via IP Remote Utility                                   |
|                                                                          |
+--------------------------------------------------------------------------+
Volumetric Characterization and Multi-Mode LUT Generation
When a user initiates a GaiaColor AutoCal routine, the monitor does not simply calibrate for a single, static target (e.g., Rec.709, 100 nits, D65). Instead, it performs a comprehensive volumetric characterization of the display panel’s native color-reproduction capabilities.
- Native Profiling: The monitor’s internal test pattern generator displays a sequence of red, green, blue, and grey patches at varying saturation and luminance levels.
- Data Logging: The directly connected probe reads these patches, feeding raw XYZ tristimulus values directly back to the monitor’s onboard processor.
- Mathematical Modeling: The processor constructs a highly detailed three-dimensional profile of the panel’s physical behavioral limits.
- Instantaneous LUT Synthesis: Once this profile is saved internally, the monitor uses its on-board math engine to dynamically generate, store, and apply calibrated 3D LUTs for any combination of:
- Color Gamuts: Rec.709, DCI-P3, Rec.2020, etc.
- Electro-Optical Transfer Functions (EOTFs): Gamma 2.2, Gamma 2.4, Gamma 2.6, ST.2084 (PQ), and HLG.
- Color Temperatures: D50, D55, D65, D93, etc.
- Luminance Targets: Custom nit levels tailored to specific viewing environments.
Because the volumetric profile contains the absolute physical limits of the panel, the monitor can generate new LUT configurations on the fly. If a user switches the monitor from a SDR Rec.709 100-nit mastering mode to an HDR ST.2084 1000-nit mode, the monitor automatically recalculates and applies the mathematically correct lookup tables instantly, without requiring a recalibration.
The 60-Second Verification Engine
While AutoCal establishes the baseline, the GaiaColor Analyzer serves as the quality control officer. Unlike AutoCal, which overwrites calibration parameters, Analyzer is strictly analytical.
When launched, Analyzer displays a targeted set of test patches to evaluate the active color-management mode. In approximately 60 seconds, the system measures:
- Luminance Accuracy: Peak white and minimum black levels.
- Grayscale Tracking: Delta E (dE) deviation across the grayscale ramp from black to white.
- Gamut Accuracy: Delta E deviation of primary and secondary colors, as well as critical skin tones and memory colors.
- EOTF Alignment: Tracking of the gamma or PQ curve.
+--------------------------------------------------------------------------+
|                     SAMPLE ON-SCREEN QC REPORT OUTLINE                   |
+--------------------------------------------------------------------------+
|  Flanders Scientific QC Report                   Date: [Timestamp]       |
|  Monitor Model: DM240                            Serial: [FSI-XXXXX]     |
|  Active Profile: Rec.709 / Gamma 2.4 / D65 / 100 nits                    |
|                                                                          |
|  OVERALL STATUS: [ PASS ]                                                |
|                                                                          |
|  METRIC             TARGET       MEASURED      DELTA E    STATUS         |
|  White Point (D65)  x:0.3127     x:0.3129      0.4        [ PASS ]       |
|                     y:0.3290     y:0.3292                                |
|  Peak Luminance     100.0 nits   99.8 nits     --         [ PASS ]       |
|  Max Grayscale dE   < 1.5 dE     0.8 dE        --         [ PASS ]       |
|  Max Color dE       < 2.0 dE     1.1 dE        --         [ PASS ]       |
|                                                                          |
|  [ Recent History: Report #1 (Pass) | Report #2 (Pass) ]                  |
+--------------------------------------------------------------------------+
Upon completion, the monitor displays an interactive, high-resolution on-screen quality control report. This report offers a clear pass/fail summary based on customizable or industry-standard tolerance thresholds, alongside detailed numerical data.
Supporting Context & Metrics: Efficiency Gains in the Field
To appreciate the business case for FSI’s GaiaColor integration, we can compare the operational metrics of traditional software-driven calibration workflows against the GaiaColor on-monitor ecosystem.
| Operational Metric | Traditional PC-Based Workflow | FSI GaiaColor Ecosystem |
|---|---|---|
| Hardware Overhead | Laptop/PC, External Pattern Generator, Probe, USB-to-Serial Adapters | Supported Probe, Monitor |
| Software Licensing | $1,000 – $3,000+ per seat (annual renewals) | $0 (Embedded in Free Firmware) |
| Setup Time | 15 – 30 minutes (cabling, software configuration) | < 1 minute (Plug probe into monitor USB) |
| Full Calibration Run | 45 – 90 minutes per monitor | 15 – 20 minutes per monitor |
| Verification Run | 15 – 30 minutes | ~60 seconds |
| QC Documentation | Manual PDF generation & file transfer | Automated, on-board storage, 1-click export |
| Operator Skill Level | Specialized Color Scientist / Senior Engineer | Assistant Editor / DIT / Video Operator |
Real-World Studio Auditing and PDF Export
In modern post-production, major streaming platforms and studios (such as Netflix, Amazon, and Disney) require strict adherence to color standards. Facilities are often mandated to submit regular calibration logs for every monitor used on a project.
The GaiaColor Analyzer addresses this administrative burden directly. The monitor’s internal memory stores the two most recent QC reports.
Using FSI’s free IP Remote Utility—a lightweight application that communicates with FSI monitors over a local area network (LAN)—engineers can instantly pull these reports off any monitor in the facility and export them as professional, audit-ready PDF files.
To accommodate different viewing environments, these PDFs can be generated in a "dark mode" for easy reading in dim grading suites, or a high-contrast "light mode" optimized for physical printing.
Industry Impact: Bridging the Gap Between LCD and OLED
By bringing GaiaColor AutoCal and Analyzer to the DM Series, Flanders Scientific is extending the lifespan and utility of its highly popular LCD monitors.
While FSI’s newer QD-OLED monitors (like the XMP310 and XMP550) represent the absolute cutting edge of high-contrast, wide-color-gamut HDR monitoring, the DM Series (such as the DM240 and DM241) remains the backbone of HD SDR broadcast, editorial suites, and on-set DIT carts.
                  +-----------------------------------+
                  |      FSI Monitor Fleet            |
                  +-----------------------------------+
                                    |
         +--------------------------+--------------------------+
         |                                                     |
+----------------------------------+        +----------------------------------+
|      XMP / XMP C Series          |        |            DM Series             |
|  (Flagship QD-OLED / HDR/SDR)    |        |    (Workhorse LCD / SDR Focus)   |
+----------------------------------+        +----------------------------------+
         |                                                     |
         +--------------------------+--------------------------+
                                    |
                                    v
                  +-----------------------------------+
                  |  Unified GaiaColor Ecosystem      |
                  |  - Identical Probe Compatibility  |
                  |  - Shared Calibration Mechanics   |
                  |  - Standardized QC Reporting      |
                  +-----------------------------------+
LCD monitors degrade differently than OLEDs. The CCFL or LED backlights in LCDs shift in color temperature and lose luminance as they age, requiring more frequent calibration touch-ups.
Integrating the GaiaColor ecosystem into the DM Series allows facility engineers to apply the exact same probe, calibration process, and QC reporting standards to both their top-tier OLED grading monitors and their secondary LCD editorial displays.
This standardization minimizes training overhead, eliminates software disparities, and ensures color consistency throughout the entire creative pipeline.
Future Outlook: The Self-Calibrating Facility
Flanders Scientific’s ongoing expansion of the GaiaColor platform points to a future where display calibration is entirely automated and decentralized.
As broadcast networks and post-production facilities scale up, manual monitor maintenance becomes an operational bottleneck. The ability to network a fleet of monitors and trigger self-contained verification routines remotely via the IP Remote Utility opens up new possibilities for facility-wide automation:
- Automated Off-Hours QC: A central server could trigger a 60-second GaiaColor Analyzer run across all networked monitors at 2:00 AM every Monday.
- Proactive Maintenance Alerts: If any monitor displays a Delta E deviation above a pre-set threshold (e.g., dE > 1.5), an automated email alert could be sent to the engineering team, scheduling that specific display for an AutoCal run.
- Instant Client Verification: Before a high-profile client session begins, a colorist can run a 60-second verification in front of the client, generating a "Pass" report that guarantees the display is performing exactly to specification.
By eliminating the PC, the software license, and the operational complexity, Flanders Scientific has transformed display calibration from a specialized chore into an effortless, push-button utility.
With the GaiaColor Analyzer and AutoCal now available across the XMP, XMP C, and DM Series, FSI has solidified its position as an industry leader in color-critical monitoring technology.