










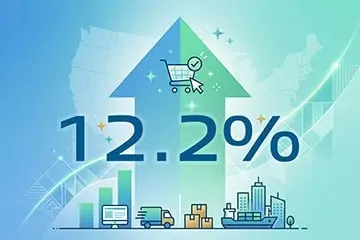
WASHINGTON — Driven by shifting consumer habits, strategic promotional calendar adjustments, and a broader return to robust digital adoption, the United States e-commerce landscape is experiencing a definitive resurgence. According to newly released data from the U.S. Census Bureau, retail e-commerce sales for the second quarter of 2026 reached a seasonally adjusted $340.2 billion. This marks a 12.2% increase year-over-year (YoY), following a strong first quarter that posted a 10.1% YoY gain.
For the first half of 2026, cumulative online retail sales hit $688.1 billion, representing an 11.1% expansion compared to the same period in 2025. This back-to-back quarter of double-digit growth represents a stark departure from the sluggish, post-pandemic cooling period that plagued the sector between 2022 and 2024. Industry analysts note that the current trajectory closely mirrors pre-pandemic growth patterns, albeit on a vastly inflated baseline.
Yet, beneath the headline-grabbing figures lie nuanced market dynamics: persistent inflationary pressures, shifting category contributions, and the ripple effects of major retail events like Amazon’s early summer Prime Day. As merchants and logistics providers look toward the remainder of the year, the central question remains whether this renewed momentum marks the dawn of a permanent structural shift or a temporary anomaly in the retail cycle.
Executive Overview: The 2026 Rebound
The narrative of American retail over the past six years has been defined by extreme volatility. The COVID-19 pandemic acted as an unprecedented catalyst, compressing a decade of digital adoption into a matter of months. When physical storefronts locked their doors in early 2020, online channels transformed overnight from a convenient alternative to an absolute necessity.
By 2026, however, the emergency-driven behaviors of the pandemic era have given way to calculated consumer habits. Online shopping is no longer driven by lockdowns or panic-buying; rather, it is anchored in convenience, expansive product availability, and seamless omnichannel integration.
| Quarter | Ecommerce Sales | QoQ Growth | YoY Growth |
|---|---|---|---|
| 2026 Q1 | $327.9B | 3.1% | 10.1% |
| 2026 Q2 | $340.2B | 3.8% | 12.2% |
The Census Bureau’s Q2 2026 metrics underscore this maturation. Total U.S. retail sales—encompassing both brick-and-mortar and digital channels—grew by 6.7% YoY during the same three-month window. Because e-commerce outpaced overall retail by nearly double, the online channel’s share of total retail sales climbed to 17.1%, up from 16.3% during Q2 2025.
Crucially, this data suggests that digital platforms are gaining independent market momentum rather than merely capturing a larger slice of a stagnating retail pie. Consumers are increasingly routing discretionary spending through online gateways, prioritizing digital-first brands and marketplaces for both routine purchases and high-ticket items.
Detailed Chronology: From Pandemic Shock to 2026 Acceleration
To understand the weight of the 2026 rebound, one must trace the trajectory of the e-commerce sector over the past seven years. The timeline reveals a market moving from acute crisis to normalization, and finally to a fresh phase of sustainable expansion.
The Pandemic Spike (2019–2022)
The seeds of the digital retail transformation were sown in late 2019. Even before global supply chains and consumer behavior were upended, Q4 2019 retail e-commerce sales in the U.S. grew by 16.2% YoY.
When the first reports of COVID-19 emerged and lockdowns rolled out across the nation, online shopping exploded. In Q2 2020, U.S. e-commerce sales skyrocketed by an astonishing 53.5% YoY, hitting $208.1 billion. For the subsequent three quarters, year-over-year growth hovered above the 40% threshold.
| Quarter | Ecommerce Sales | QoQ Growth | YoY Growth |
|---|---|---|---|
| 2019 Q2 | $135.5B | 4.10% | 10.20% |
| 2019 Q3 | $144.1B | 6.30% | 14.60% |
| 2019 Q4 | $150.2B | 4.20% | 16.20% |
| 2020 Q1 | $156.9B | 4.40% | 20.50% |
| 2020 Q2 | $208.1B | 32.60% | 53.50% |
| 2020 Q3 | $212.4B | 2.00% | 47.30% |
| 2020 Q4 | $217.2B | 2.30% | 44.50% |
| 2021 Q1 | $227.9B | 5.00% | 45.30% |
| 2021 Q2 | $236.0B | 3.50% | 13.40% |
| 2021 Q3 | $232.2B | -1.60% | 9.30% |
| 2021 Q4 | $239.8B | 3.30% | 10.40% |
| 2022 Q1 | $244.0B | 1.70% | 7.00% |
| 2022 Q2 | $248.0B | 1.60% | 5.10% |
As society reopened and consumers rushed back to physical stores, restaurants, and entertainment venues, the meteoric rise of online retail cooled off sharply. By Q2 2022, annual e-commerce growth had slowed to a modest 5.1%, initiating a multi-year period of digestion and market correction.
The Gradual Ascent (2025–2026)
Following the post-pandemic hangover, online sales growth began a steady, incremental climb throughout 2025. Quarterly YoY growth printed at 5.0% in Q2 2025, ticked up to 5.3% in Q3, and finished the year at 5.9% in Q4.
| Quarter | Ecommerce Sales | QoQ Growth | YoY Growth |
|---|---|---|---|
| 2025 Q2 | $303.3B | 1.9% | 5.0% |
| 2025 Q3 | $310.8B | 2.5% | 5.3% |
| 2025 Q4 | $318.0B | 2.3% | 5.9% |
| 2026 Q1 | $327.9B | 3.1% | 10.1% |
| 2026 Q2 | $340.2B | 3.8% | 12.2% |
This steady buildup broke through a psychological ceiling in early 2026, when Q1 YoY growth doubled to 10.1% and Q2 accelerated further to 12.2%. This performance indicates that the digital retail sector has firmly escaped its post-pandemic plateau.
Supporting Context & Metrics: Unpacking the Numbers
While the top-line data paints an overwhelmingly positive picture, economists and retail strategists emphasize the need to evaluate underlying variables that influence these figures.
Inflationary Pressures and Calendar Shifts
Two critical caveats accompany the Census Bureau’s Q2 2026 report. First, the reported figures are unadjusted for inflation. Consequently, a non-trivial portion of the dollar-value increase is attributable to higher price tags across consumer goods rather than purely higher unit volumes.
Second, the retail calendar experienced a strategic disruption this year. Major e-commerce catalysts—most notably Amazon’s Prime Day—were shifted into June. This scheduling maneuver potentially pulled billions of dollars in consumer spending forward from the traditionally quieter third quarter into the second quarter. As a result, analysts caution that Q3 2026 metrics may exhibit a relative cooling or normalization effect when compared against this artificially inflated Q2 baseline.
Category-Level Divergence
While overall e-commerce grew by 12.2% year-over-year in Q2 2026, individual product categories experienced vastly divergent fortunes.
| Category | Q2 2025 Ecommerce | Q2 2026 Ecommerce | Growth | Added Sales |
|---|---|---|---|---|
| General merchandise | $38.5B | $46.9B | 21.60% | +$8.3B |
| Building materials & garden | $12.3B | $13.7B | 11.50% | +$1.4B |
| Food & beverage | $9.6B | $10.3B | 8.10% | +$775M |
| Sporting goods, hobby, books | $3.3B | $4.0B | 20.40% | +$673M |
| Clothing & accessories | $15.5B | $16.1B | 3.80% | +$592M |
| Health & personal care | $2.4B | $2.6B | 9.30% | +$220M |
The data highlights a vital distinction in retail analytics: percentage growth does not equal absolute market contribution.
For instance, "Clothing and accessories" posted a sluggish 3.8% YoY growth rate in Q2 2026, adding $592 million in new sales. Conversely, "Health and personal care" expanded at a much faster clip of 9.3%, yet added a modest $220 million due to its smaller baseline market size.
A starker illustration appears among heavy-hitting sectors. "General merchandise"—encompassing mass merchants, department stores, and broad-inventory online marketplaces—surged by 21.6%, injecting a staggering $8.3 billion in new sales into the ecosystem. Meanwhile, "Building materials and garden" saw a solid 11.5% growth rate, translating to an additional $1.4 billion.
These figures demonstrate that while percentage growth provides essential context regarding consumer interest and sector velocity, absolute market size dictates true financial impact. A mature category growing at a single-digit rate can still generate billions in cash flow, whereas a high-growth niche may represent a relatively minor slice of total digital commerce.
Official Statements and Industry Perspective
Industry leaders and financial analysts have been quick to react to the Census Bureau’s Q2 disclosure, interpreting the data through various lenses of supply chain strategy, consumer confidence, and platform diversification.
Speaking on condition of anonymity, a senior retail strategist at a major global logistics firm noted:
"What we are witnessing in 2026 is the stabilization of omnichannel retail. Consumers are no longer debating whether to buy online or offline—they are utilizing both fluidly. However, the re-emergence of double-digit growth tells us that the digital channel is once again capturing the lion’s share of discretionary wallet expansion. Retailers who failed to optimize their fulfillment networks during the 2022–2024 lull are now scrambling to catch up."
Furthermore, market researchers emphasize that individual business performance frequently diverges from broader category averages. Factors such as unique product mixes, pricing strategies, third-party marketplace integration (such as Amazon, Walmart Marketplace, and TikTok Shop), geographic footprints, and targeted consumer demographics mean that merchant experiences will vary widely. A brand operating within a slow-growing category can still achieve hyper-growth if it captures market share from legacy competitors.
Future Outlook: Strategic Implications for the Rest of 2026
As the retail industry pivots toward the back half of 2026—historically dominated by the critical back-to-school season and the Q4 winter holidays—stakeholders face important strategic decisions.
Capital Allocation and Inventory Planning
The return of sustained, predictable double-digit growth provides corporate boards and retail executives with the confidence needed to unlock capital expenditure. For years, economic uncertainty forced companies into defensive postures, prioritizing lean inventories and conservative customer acquisition budgets.
The Q2 2026 metrics could justify renewed, aggressive investment in:
- Advanced Inventory Management: Stocking up to meet rising demand in high-performing categories like general merchandise and home improvement.
- Customer Acquisition & Retention: Ramping up digital ad spend and loyalty programs to capture expanding consumer wallets.
- Fulfillment Capacity: Upgrading warehouse automation, micro-fulfillment centers, and shipping logistics to handle higher throughput without sacrificing delivery speed.
Navigating Uneven Economics
Despite the optimistic macro data, the underlying fragmentation across product categories serves as a warning against blanket strategies. Retailers must look closely at their specific product mix. While general merchandise and hobby goods are riding a wave of robust consumer enthusiasm, apparel and specialized consumables require nuanced pricing and promotional strategies to stimulate demand.
The coming quarters will test whether 2026 represents a permanent upward recalibration of the U.S. e-commerce market or a temporary peak driven by calendar anomalies and inflationary tailwinds. For merchants equipped with agile supply chains, sophisticated data analytics, and a multi-channel presence, the current environment presents a fertile landscape for sustained expansion.